Announcing the MS Fabric Users Slack Channel

Are you a Microsoft Fabric user looking to supercharge your collaboration and networking? We’re excited to announce our new Slack channel MS Fabric Users, tailor-made for people who want to engage with a dynamic and supportive community. By moving our conversations from the traditional forums to Slack, we’re creating a space that’s built for speed, ease, and connectivity.

Why We’re Choosing Slack Over the Fabric Community Forum:

I am already using different Slack channels for other technologies I use on my daily basis (Delta Lake, Databricks Users, VSCode Development, …) and when it comes to interactive collaboration, I think Slack is much more efficient in getting answers to your immediate questions than traditional forums etc. Here are some other reasons why I think that’s the case:

1. Real-Time Communication: 

Slack’s instant messaging platform means you can get answers to your questions and feedback on your projects without waiting for forum replies. Connect with peers in seconds, not minutes or hours.

2. Better Organization with Channels:

Create and participate in topic-specific channels that keep discussions focused and relevant. Whether you’re interested in theming, components, or best practices, channels make it easy to find and partake in conversations that matter to you.

3. Enhanced Collaboration:

With Slack, collaboration is not just about talking – it’s about doing. Share code snippets, files, and resources effortlessly with the drag-and-drop interface. Pair that with integrations like GitHub and Trello, and you’ve got a powerful toolkit right at your fingertips.

4. Accessibility On-the-Go:

Stay connected with the community wherever you are. The Slack mobile app provides a seamless experience, ensuring you never miss out on important discussions no matter where you work from.

5. Advanced Search Capabilities:

Slack’s powerful search function makes it easy to find relevant conversations, shared files, and announcements. No more sifting through pages of forum posts to find the information you need.

Join the Fabric Slack Community:

We believe community is key to learning and growing as a developer. By switching to Slack, we’re not just changing the platform – we’re enhancing the way we connect, engage, and support each other as Microsoft Fabric users.

To get started, join our Slack channel today! Simply visit MS Fabric Users to sign up and dive into the conversations happening right now. We can’t wait for you to be a part of this vibrant, collaborative community!

(Credits to ChatGPT for writing most of this blog post 🙂 )

Databricks VSCode Extension – Release v1.0!

As you probably know from my previous posts, my colleagues at paiqo.com and I are constantly working to improve our VSCode extension for Databricks. Almost every month we silently release a new version to the VSCode gallery so you get the latest features. However, as this is a special release, I am also writing a dedicated blog post for it

We are very happy to finally announce the first official release of our VSCode extension for Databricks!

Probably the biggest and most awaited new feature is the ability to interactively execute your local Spark/SQL/Scala/R code against one of your running Databricks clusters and get the results back in VSCode! At least every 3rd issue that was opened in our Github Repo was requesting this feature and now it is finally here. It integrates seamlessly into VSCode notebooks by automatically creating a new kernel for every active Databricks cluster in your workspace. So just open one of your notebook, select the Databricks cluster kernel and start working!

Integrating it natively with VSCode notebooks brings some very nice features out of the box:

  • leverages all other extensions that work with Python or notebooks:
    syntax highlighting, auto-completion, colored indention levels (e.g using indent-rainbow)
  • use custom renderers to visualize your tables (e.g. vscode-data-tables)

In addition to all the features already mentioned above, it also solves some issues that you may had with other solutions like databricks-connect (which is also deprecated by now). The following things also work with the new Databricks VSCode notebook kernel:

  • full access to the DBFS including mountpoints
  • most dbutils functions like dbutils.secrets
  • magics like %pip, %md and all language-specific magics

However, besides all those great new features and capabilities, there are also some things that still need improvement. Here is a list of known issues:

  • widgets are currently not supported – that’s our highest priority at the moment
  • features from files-in-repos are not yet supported
  • only works with .ipynb files
  • the notebook sometimes opens twice
  • found any other issues? report them at at issues-page

All further details can be found in the README.md of the Github repository.

Let us know what you think of and provide some feedback! If you already had an older version of the extension installed, it will update automatically. If you have not used it yet, just install it directly via the VSCode extensions or download it from the VSCode gallery or our GitHub repository:

VS Code gallery: paiqo.Databricks-VSCode
Github repository: Databricks-VSCode

Using Power BI Field Parameters to translate Data and Values

When building an enterprise reporting solution with Power BI, a question that always comes up is how to handle translations. Large enterprises operate in various countries where people also speak different languages. So a report should be available in all frequently used languages. Ideally, you just create a report once and then a user can decide (or it is decided for him) in which language the report is displayed.

Power BI only partially supports this scenario and the closest we could get *before field parameters* were introduced is already very well described by Chris Webb’s blog post on Implementing Data (As Well As Metadata) Translations In Power BI – a must-read if you need to deal with translations in Power BI. Another good read on the topic is the blog post Multilingual Reports in Power BI from PBI Guy.

As you will quickly realize, the translation of metadata is already pretty easy as it is baked into the engine. Unfortunately this is not the case when you need to translate actual data values (e.g. product names, …). In the multidimensional version of Analysis Services this just worked like a charm as it was also a native feature but this feature never made it to Analysis Services Tabular Models, Azure Analysis Services or Power BI.

The current approaches when it comes to data and value translations are more workarounds than actual solutions. They probably work fine for small data models and very specific use-cases but usually fall short in performance, usability or maintainability when implemented on a larger scale enterprise models.

The recently introduced Field Parameters in Power BI give us a bit more flexibility here and another potential solution to implement data and value translations in Power BI.

Here is what we want to achieve:

  • create a single report only
  • support for multiple languages – metadata and column data
  • only minor changes to the existing data model

How can Field Parameters help here?

Field Parameters allow you to select the columns you want to display in your report/visual on-the-fly. Based on the selection, the reporting engine decides which physical column(s) it needs to use in the query it generates and sends to the data model.
So we can create a Field Parameter for the different columns that hold the translated data values and already easily switch the language by changing the selection of our Field Parameter. This is how our Filed Parameter would be defined:

I did this for all the fields for which translated values are actually provided. Usually this is just a very small subset of all the available columns!

As you can see, Field Parameters allow you to translate the metadata (first value) and also to define the column to use for the data values (second value, using NAMEOF() function).

To change all field parameters at once I introduced an additional 4th column that holds the culture/language of the current row which is then linked to another static DAX table that is defined as follows:

Then relationships are set up between these tables:

In your report you can now simply use the column from the field parameters and add a slicer for the Language table to control which language is displayed. Note: this must be a single-select slicer as otherwise Power BI will build a hierarchy of the different languages!

Here is the final result:

(please use Full Screen mode from bottom right corner)

As you can see, we just created a single report that supports multiple languages for both, metadata and data values, allows you to easily switch between them and provides similar performance as if you would have built the report for a single language only!

There are still some open questions when it comes to translating all the labels used on the whole report which is already partially covered in the other blog posts referenced above but this approach brings us another step further to a fully translatable report.

Another nice feature of this approach is that you can also put security on top of the Language/Culture table so a user only sees exactly one row – the one with the language/culture of his choice or country. So a user would not even need to select the language but it would be selected for him automatically!
Ideally you could even use the USERCULTURE() DAX function but unfortunately this is currently not supported in the PBI service. There is already an open idea for which you can vote if this is important to you.
USERCULTUER() DAX function is now finally general available also in the service: https://powerbi.microsoft.com/en-us/blog/userculture-dax-function-now-supported-in-power-bi-premium/

The .pbix file can be downloaded here: PBI_Translations.pbix

Automating the Extraction of BIM metadata from PBIX Files using CI/CD pipelines

The latest updates can always be found in the

PowerBI.CICD repository

In the past I have been working on a lot of different Power BI projects and it has always been (and still is) a pain when it comes to the deployment of changes across multiple tiers(e.g. Dev/Test/Prod). The main problem here being that a file generated in Power BI desktop (.pbix) is basically a binary file and the metadata of the actual data model (BIM) cannot be easily extracted or derived. This causes a lot of problems upstream when you want to automate the deployment using CI/CD pipelines. Here are some common approaches to tackle these issues:

  • Use of Power BI deployment pipelines
    The most native solution, however quite inflexible when it comes to custom and conditional deployments to multiple stages
  • Creation a Power BI Template (.pbit) in addition to your .pbix file and check in both
    This works because the .pbit file basically contains the BIM file but its creation is also a manual step
  • Extraction of the BIM file while PBI desktop is still running (e.g. using Tabular Editor)
    With the support of external tools this is quite easy, but is still a manual step and requires a 3rd party tool
  • Development outside of PBI desktop (e.g. using Tabular Editor)
    Probably the best solution but unfortunately not really suited for business users and for the data model only but not for the Power Queries

As you can see, there are indeed some options, but none of them is really ideal, especially not for a regular business user (not talking about IT pros). So I made up my mind and came up with the following list of things that I would want to see for proper CI/CD with Power BI files:

  • Users should be able to work with their tool of choice (usually PBI desktop, optional with Tabular Editor or any other 3rd party tool)
  • Automatically extracting the metadata whenever the data model changes
  • Persisting the metadata (BIM) in git to allow easy tracking of changes
  • Using the persisted BIM file for further automation (CD)

Solution

The core idea of the solution is to use CI/CD pipelines that automatically extracts the metadata of a .pbix file as soon as it is pushed to the Git repository. To do this, the .pbix file is automatically uploaded to a Power BI Premium workspace using the Power BI REST API and the free version of Tabular Editor 2 then extracts the BIM file via the XMLA endpoint and push it back to the repository.

I packaged this logic into ready-to-use YAML pipelines for Github Actions and Azure DevOps Pipelines being the two most common choices to use with Power BI. You can just copy the YAML files from the PowerBI.CICD repository to your own repo. Then simply provide the necessary information to authentication against the Power BI service and that’s it. As soon as everything is set up correctly. the pipeline will automatically create a .database.json for every PBIX file that you upload (assuming it contains a data model) and track it in your git repository!

All further details can be found directly in the repository which is also updated frequently!

Doing relative-time Slicers properly in Power BI

A very common requirement for a Power BI report that I stumble across at almost all of my customers is to automatically show data for the current day/month/year when a report is opened. At first sight this seems like a very trivial problem but once you dig into the problem, you will realize that all of the common solutions out there have some disadvantages and only solve the problem partially.

So here is what we want to achieve:

  • Show the Current Month (or Day, or Year)  by default
  • Works [in combination] with all other columns in the date table.
  • A single, easy to use slicer/filter to control the time selection and change from Current Month/Day/Year to any other value
  • Works with built-in time intelligence functions
  • Works with existing DAX measures
  • Works with any datamodel/report

Solutions like Relative Time Filter/Slicer, DAX or relative flags in the date table address only some points of the above list but definitely not all of them which is why I thought we need a better solution to this:

(please use full-screen mode)

We actually created a new table in our data model that is linked to the original date table. The reason why we cannot use the same table here is that the new table does not have unique date values as all dates/rows referring to our current calculations are duplicated. It has to be a many-to-one relationship with cross-filter direction set to both (even though we will only use the new table ‘Calendar_with_current’ to filter the existing table ‘Calendar’):

And that’s it basically. You can now exchange the original Calendar table with the new one to get the new “Current” values in your report. If you have time intelligence functions in place, you further need to extend them and add ALL('Calendar_with_current ') as a filter to make them work also with the new table. The old table can also be hidden now if you do not want to confuse the end users. To make a seamless switch you can further rename the tables.

I added an additional column to the table called Type that allows you to select which values you want to show – the original values (e.g. “September”), the values with “Current X” (e.g. “Current Month”), or both.Please see the second page/tab of the embedded report above.

So this raises the question how this new table can be created? To simplify this I have created a Power Query function that takes 3 parameters:

  • The current date table
  • A list of definitions of your current-values
  • The name of the unique date-column in your current date table (parameter 1)

The first and the third parameter should be clear, but what are the “CurrentDefinitions”?

It is basically a table which defines the relative time calculations that you want to extend your existing date table with. Here is an example:

The column Column refers to the column in which you want to create the relative date definition. The column NewValue specifies the value that you want to set for rows that match the third column Filter. The column Filter either takes a static filter expression like [RelativeMonth] = 1 (as in lines 5-8) but can also use existing M-functions and reference the existing Date-column using the placeholder <<DateColumn>> as you can see in lines 1-4.

The table can be maintained using “Enter Data” and can contain any number of rows/definitions!

For most of my scenarios this works pretty well and addresses all major problems highlighted above.

The latest Power Query function can be downloaded from my github repository: fn_DateTableWithCurrentCalculations.pq
Power BI desktop files can be downloaded from here: PBIX PBIT

Custom functions and complex return types in Power Query

When working with Power Query, you have probably already realized that every expression you write returns a value of a specific type. Usually this will be a primitive type like text, number, or date. (A full list of types available in Power Query can be found here: https://docs.microsoft.com/en-us/powerquery-m/m-spec-types). If for some reason the type of an expression cannot be defined, the special type *any* will be used. For sure you already encountered this when using Table.AddColumn which, by default, results in the new column being of type *any*.

To avoid this, you can use the optional fourth parameter and specify the resulting type of the expression. This can be very handy and saves you the Change Type step that usually comes afterwards.

This fourth parameter not only works for primitive types but also for complex types. If you do not specify it, the column type is again *any* even though the actual values are records:

Once you click the Expand-Button of the new MyRecord column in the table header, you will realize a short delay until the available fields are displayed. This indicates that PQ first has to evaluate the expression before it can provide you the list of fields within the record. For complex scenarios, this can take a long time and can also be avoided by explicitly specifying the type in the fourth parameter as shown below:

As you can see, PQ can now immediately display the available columns without having to evaluate the function!

This also works the very same way if you call a custom function as expression of your Table.AddColumn. But there is the caveat: If you have a function that returns a complex type, let’s say a record, you will usually want to specify the type as part of the function or within the definition of the function and not re-type it again each time you call the function.

Fortunately, there is a solution to this problem: the function Type.FunctionReturn. In combination with Value.Type you can derive the return type from the function dynamically!

So, if you have the following function:

You can derive the resulting type of the function by using a combination of Type.FunctionReturn and Value.Type as shown below:

Ok, so this is already pretty cool – but what happens if your function returns a complex type like a record or a table?

You will realize that you can simply replace “as text” with “as record” and the function would now return a record – at least logically, you also need to change the actual expression:

and then call it as before:

You will realize that now again it takes some time until the available fields are displayed indicating the function must be evaluated first. Another indicator for this to happen is the warning at the bottom and the link to “Load more”. If you think of it, this makes sense – Power Query knows that the function now returns a record, but does not know which fields the record contains and thus has to evaluate it. So how can we combine custom function that return complex types and the ability to specify the resulting type as part of the function?

The first thing that would come to your mind is to simply strong-type the return type of the function specifying each field individually, but this will result in an error:

Currently it is not supported to specify a complex type as the return type of a function – it only works with primitive types. But as you can guess, I did not start this blog post for no reason. There is a way to achieve this, even though it may not be as nice as it could and should be.

The solution here is the Type.ForFunction function which allows you to create a more specific definition of your function including the return type. This definition/type can then be applied to your original function using Value.ReplaceType:

You basically first define the final return type of the function and the function itself (lines 2 and 3). The other lines (5 to 10) take care of applying the return type to the function which can then be used in combination with the approach above to dynamically derive the return type when calling the function (using ype.FunctionReturn and Value.Type). This now allows you to specify everything that is related to the function in one place!

This is especially handy if you have a function that returns a record or a table which is re-used multiple times and the fields/columns may change over time. Using this approach allows you to only change the function and everything else is derived automatically.

Sample workbook for download: PQ Custom Function return types.pbix

Upcoming Conferences – Fall and Winter 2016

The next months are going to be quite busy for me. There will be a lot conferences and events which I will attend and where I am also speaking. I am always happy to attend those events as it is a great place to interact with other community members and learn new stuff about the latest and coolest new tools. So lets get started:

The first conference is the SQL Saturday #546 in Oporto (Portugal) on the 1st of October where I will be speaking about “What’s new in Analysis Services 2016”.
PASS_SQL_Saturday_546_Oporto
It is the first time for me to speak in Porto but from what I heard from other people it is said to be a really great event so I am really looking forward to it!

The week after – on the 6th of October – I will be speaking at the “Virtuelle SQL Server 2016 Konferenz” (German only) where I will be doing a session on SQL Server Polybase. As the name implies, it is virtual and you can attend from wherever you are at the time. Another important thing is that it is for free! You just need to register and you’ll get two full days of sessions around SQL Server and the Microsoft Data Platform.

In the same week, the SQL Saturday #555 in Munich (Germany) is taking place.
PASS_SQL_Saturday_555_Munich
Another free event for all community members. Again, just make sure you register in time to get a ticket! I will do a more advanced session on Polybase there with a more technical focus. So even if you attended the virtual event before, this might still be of great value for you!

Later in October, the world’s biggest conference about the Microsoft Data Platform and all other related technologies – the PASS Summit – will be in Seattle again, attracting 4,000+ attendees every year.
PASS_Summit_2016
It’s probably a bit late but you can still register for this great event. Unfortunately, I forgot to submit some sessions for this conference so I won’t be there this year. (Note to myself: submit sessions for 2017!) Having been there already several times, I can only recommend this conference to anyone who is into Microsoft, it’s Data Platform and everything around it.

For January 2017, I am very happy to announce that our SQL Saturday #579 in Vienna (Austria) is taking place the 4th year in a row now.
PASS_SQL_Saturday_579_Vienna
We had 250+ attendees last year and we are definitely aiming to hit the 300 mark this year! Again, it is free and you just need to register as soon as possible. (In case you cannot make it later on, please unregister as early as possible as otherwise you take away the slot of someone else). The Call for Papers is still open so if you want to speak at the event, simply submit your session details there.

Last but not least, the SQL Server Konferenz 2017 will be back in Darmstadt as in the previous years.
PASS_SQL_Konferenz_2017
This means 3-4 full days of sessions and trainings around the Microsoft Data Platform. Overall an awesome event organized by PASS Germany. It is also the 5th time in a row this year and believe me, they have organized and optimized everything down to the tiniest detail making it one of the best and biggest conferences in whole Europe!
I already submitted some sessions and I am hoping to be selected to speak there.

As you can see, a lot of things are ahead but I am really looking forward to all of them!

Upcoming Events I am speaking at in June 2015

I am very glad that I got selected as a speaker for two upcoming SQL Saturdays in June. First there is the SQL Saturday #409 in Rheinland, Germany  on June 13 and the week after the SQL Saturday #419 in Bratislava, Slovakia on June 20.

For those of you who are new to the concept of PASS SQL Saturdays, this is a series of free-of-charge events all around the globe where experienced speakers talk about all topics around the Microsoft SQL Server platform and beyond. As I said, its free, you just need to register in time in order to get a ticked so better be fast before all slots are taken!

SQLSaturday_409_Rheinland_Germany

I will do a session together with my colleague Markus Begerow (b, t) on “Power BI on SAP HANA” – two technologies I got to work a lot with recently. We are going to share our experience on how to use Power BI to extract data from SAP HANA, the different interfaces you can use and the advantages and drawbacks of each. Even tough it is considered a general sessions, we will also do a lot of hands on and elaborate on some of the technical details you need to be aware of, for both, the Power BI side and also for SAP HANA.


SQLSaturday_419_Bratislava_Slovakia

In Bratislava I will speak about Lessons Learned: SSAS Tabular in the real world where I will present the technical and non-technical findings I made in the past when implementing SSAS Tabular models at larger scales for various customers. I will cover the whole process from choosing SSAS Tabular as your engine (or not choosing it), things to consider during implementation and also shed some light on the administrative challenges once the solution is in production.

I think both are really interesting sessions and I would be happy to see a lot of you there and have some interesting discussions!

Happy New Year! – How about some Conferences?

2015 just started – and it is a quickstart in terms of SQL Server conferences! There is quite a lot of upcoming conferences and I am happy that most of them are in Europe.

Below you can find a short overview followed by some more details:

What? When? Where? Am I there?
German SQL Server Conference February 3-5th Darmstadt, Germany Yes, I am speaking!
SQL Saturday Vienna February 27-28th Vienna, Austria Maybe, but not speaking
SQLRally Nordic Copenhagen March 2-4th Copenhagen, Denmark Yes, I am speaking!
SQLBits XIV Superheroes March 4-7th London, UK Yes, I am speaking!

UPDATE 2014-01-13:
I just received a confirmation that my session “Power BI on SAP HANA” was accepted for SQL Bits XIV!
It’s also the first time that I will do a session together with a Co-Speaker, my colleague Markus Begerow (b)


It starts with the German SQL Server Conference 2015 on February 3-5th
728x90_SQL_Server_Konferenz_EN
I am also very happy that my session “Load testing Analysis Services” was selected and I will be speaking the second time in a row at this awesome conference which is also the biggest German SQL Server Conference out there. And now worries, there are also a lot of English session in case you do not speak German Winking smile

Up next is a true marathon of conferences starting with the SQL Saturday #374 in Vienna on 28th of February.
SQLSaturday_374_Vienna
This year also featuring Pre-Cons on 27th of February!
Reza Rad (t, b) and Leila Etaati (t, b) will be speaking on “Power BI from Rookie to Rockstar” and Dejan Sarka (t, b) on “Advanced Data Modeling
Last year it was fully booked pretty soon and we had a long waiting list so better do your reservation now!
The schedule can be found here and features 20 sessions of well-know SQL Server professionals.

Directly after the SQL Saturday in Vienna the PASS SQLRally Nordic opens its doors in Copenhagen again on March 2-4.
SQLRally_2015_Copenhagen_Banner
The official schedule was just released today and can be found here (full PDF)!
I will deliver my session “Deep-Dive to Analysis Services Security” on Wednesday 4th.

Last but definitely not least is SQLBits Conferences, Europe’s biggest SQL Server conference, which is taking place the 13st time now on March 4-7 in London. (don’t get confused just because its SQL Bits XIV, Microsoft also skipped Windows 9 Open-mouthed smile). This year its all about Superheroes and a lot of SQL Server Superheroes will be there!
SQLBits_Superheroes
A schedule is not available yet but will be made public within the next days I guess so stay tuned!

UPDATE 2014-01-13:
The official schedule will soon be available here. Our Session is very likely to be on Friday.

Hope to see you there!

Another Post about Calculating New and Returning Customers

I know, this topic has already been addressed by quite a lot of people. Chris Webb blogged about it here(PowerPivot/DAX) and here(SSAS/MDX), Javier Guillén here, Alberto Ferrari mentions it in his video here and also PowerPivotPro blogged about it here. Still I think that there are some more things to say about it. In this post I will review the whole problem and come up with a new approach on how to solve this issue for both, tabular and multidimensional models with the best possible performance I could think of (hope I am not exaggerating here  🙂 )

OK, lets face the problem of calculating new customers first and define what a new customer for a given period actually is:

A new customer in Period X is a customer that has sales in Period X but did not have any other sales ever before. If Period X spans several smaller time periods
(e.g. Period X=January contains 31 days) then there must not be any sales before the earliest smaller time period (before 1st of January) for this customer to be counted as a new customer.

According to this definition the common approach can be divided into 2 steps:
1) find all customers that have sales till the last day in the selected period
2) subtract the number of customers that have sales till the day before the first day in the
selected period


First of all we need to create a measure that calculates our distinct customers.
For tabular it may be a simple calculated measure on your fact-table:

Total Customers:=DISTINCTCOUNT(‘Internet Sales’[CustomerKey])

For multidimensional models it should be a physical distinct count measure in your fact-table, ideally in a separate measure group.

How to solve 1) in tabular models

This is also straight forward as DAX has built-in functions that can do aggregation from the beginning of time. We use MAX(‘Date’[Date]) to get the last day in the current filter context:

Customers Till Now:=CALCULATE(
[Total Customers],
DATESBETWEEN(
‘Date’[Date],
BLANK(),
MAX(‘Date’[Date])))


How to solve 2) in tabular models

This is actually the same calculation as above, we only use MIN to get the first day in the current filter context and also subtractt “1” to get the day before the first day.

Previous Customers:=CALCULATE(
[Total Customers],
DATESBETWEEN(
‘Date’[Date],
BLANK(),
MIN(‘Date’[Date])-1))


To calculate our new customers we can simply subtract those two values:

New Customers OLD:=[Customers Till Now]-[Previous Customers]


How to solve 1) + 2) in multidimensional models

Please refer to Chris Webb’s blog here. The solution is pure MDX and is based on a combination of the range-operator “{null:[Date].[Calendar].currentmember}”, NONEMPTY() and COUNT().


Well, so far nothing new.


So lets describe the solution that I came up with. It is based on a different approach. To make the approach easily understandable, we have to rephrase the answer to our original question “What are new customers”?”:

A new customer in Period X is a customer that has his first sales in Period X.

According to this new definition we again have 2 steps:
1) Find the first date with sales for each customer
2) count the customers that had their first sales in the selected period

I will focus on tabular models. For multidimensional models most of the following steps have to be solved during ETL.


How to solve 1) in tabular models

This is pretty easy, we can simply create a calculated column in our Customer-table and get the first date on which the customer had sales:

=CALCULATE(MIN(‘Internet Sales’[Order Date]))


How to solve 2) in tabular models

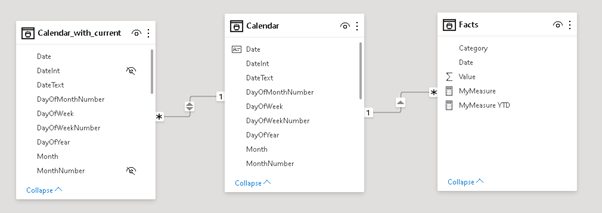
The above create calculated column allows us to relate our ‘Date’-table directly to our ‘Customer’-table. As there is already an existing relationship between those tables via ‘Internet Sales’ we have to create an inactive relationship at this point:

Customer_Date_Relationship

Using this new relationship we can very easy calculate customers that had their first sales in the selected period:

New Customers:=CALCULATE(
COUNTROWS(Customer),
USERELATIONSHIP(Customer[FirstOrderDate], ‘Date’[Date]))


Pretty neat, isn’t it?
We can use COUNTROWS() opposed to a distinct count measure as our ‘Customer’-table only contains unique customers – so we can count each row in the current filter context.
Another nice thing is that we do not have to use any Time-Intelligence function like DATESBETWEEN which are usually resolved using FILTER that would iterate over the whole table. Further it also works with all columns of our ‘Date’-table, no matter whether it is [Calendar Year], [Fiscal Semester] or [Day Name of Week]. (Have you ever wondered how many new customers you acquired on Tuesdays? 🙂 )   And finally, using USERELATIONSHIP allows us to use the full power of xVelocity as native relationships are resolved there.


The results are of course the same as for [New Customers OLD]:

Result_Old_vs_New


Though, there are still some issues with this calculation if there are filters on other tables:

Issue_Old_vs_New

As you can see, our new [New Customers] measure does not work in this situation as it is only related to our ‘Date’-table but not to ‘Product’.

I will address this issue in a follow-up post where I will also show how the final solution can be used for multidimensional models – Stay tuned!

Download Final Model (Office 2013!)


UPDATE: Part2 can be found here