I am very proud to announce the first public release of Fabric Studio v1.0 – a VSCode extension that allows you to manage and develop your Fabric workspace(s). Similar to Power BI Studio, it seamlessly integrates into VSCode for increased productivity for professional developers and admins alike.
It includes a lot of different features of which the most notable are probably these:
- a generic workspace browser supporting all Fabric item types and their most common API actions
- a custom file system provider allowing you to modify Fabric items as if they were local
- a dedicated deployment pipeline manager
- an integration of the Fabric Git into VSCode source control
- a VSCode Fabric notebook to run arbitrary API calls
- …
Workspace Browser
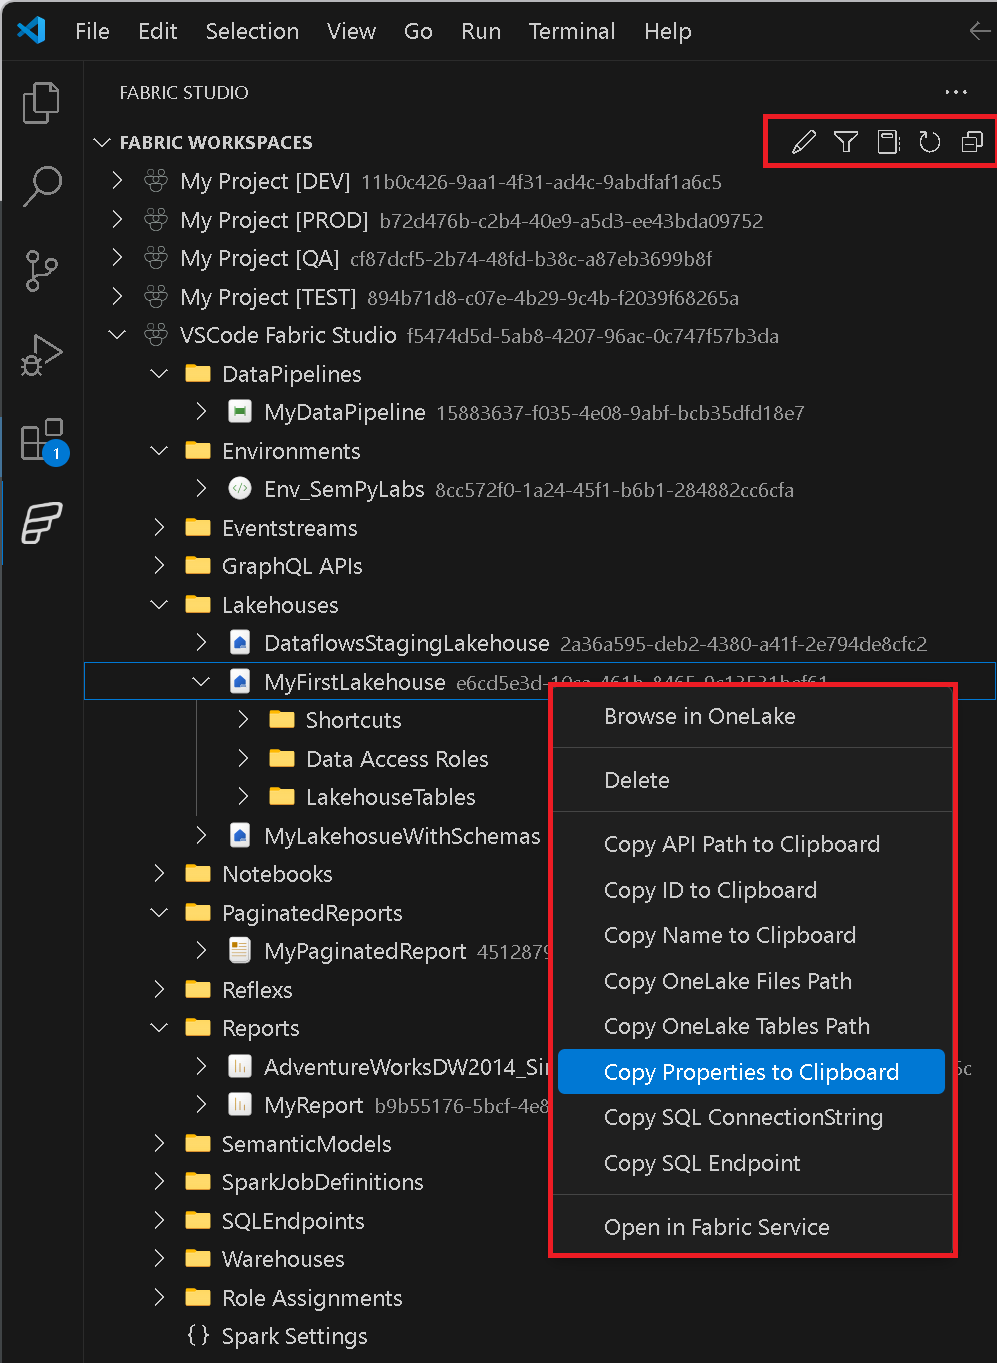
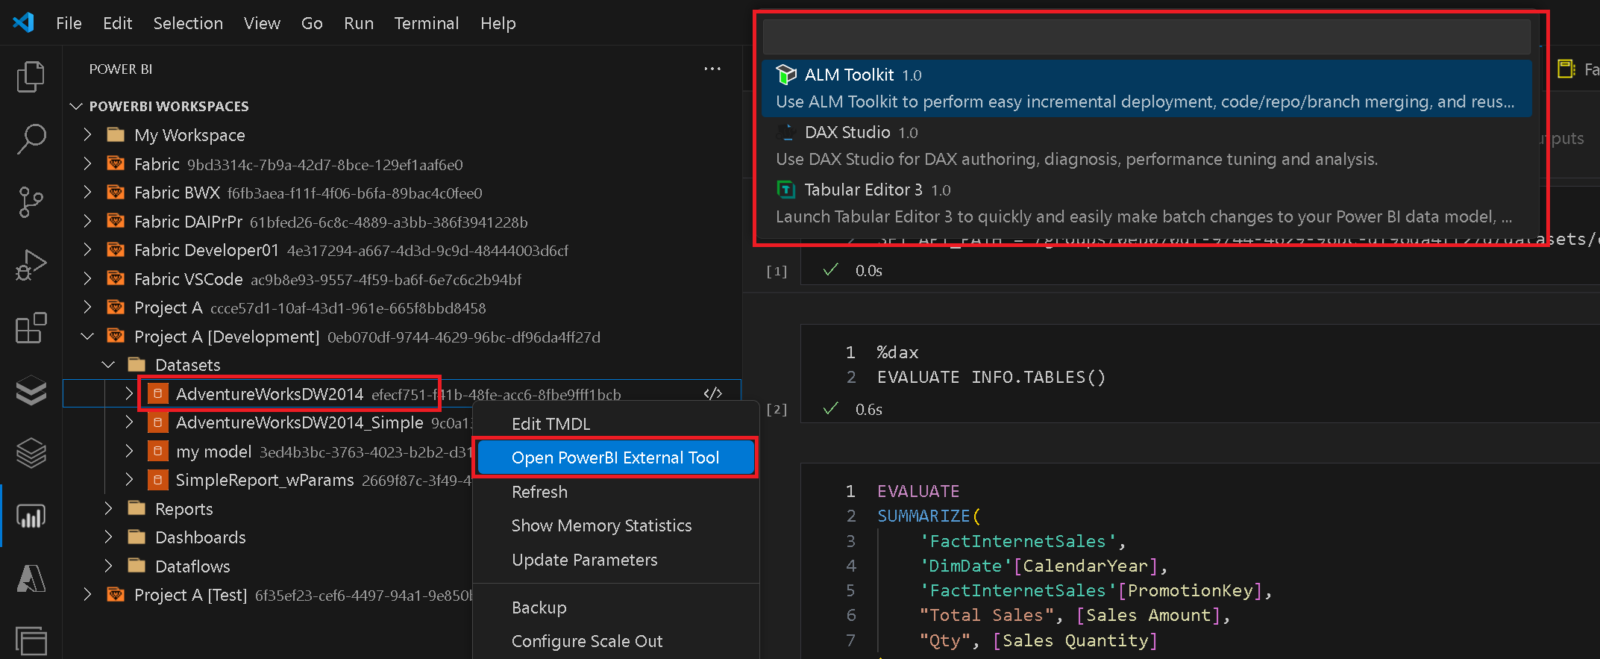
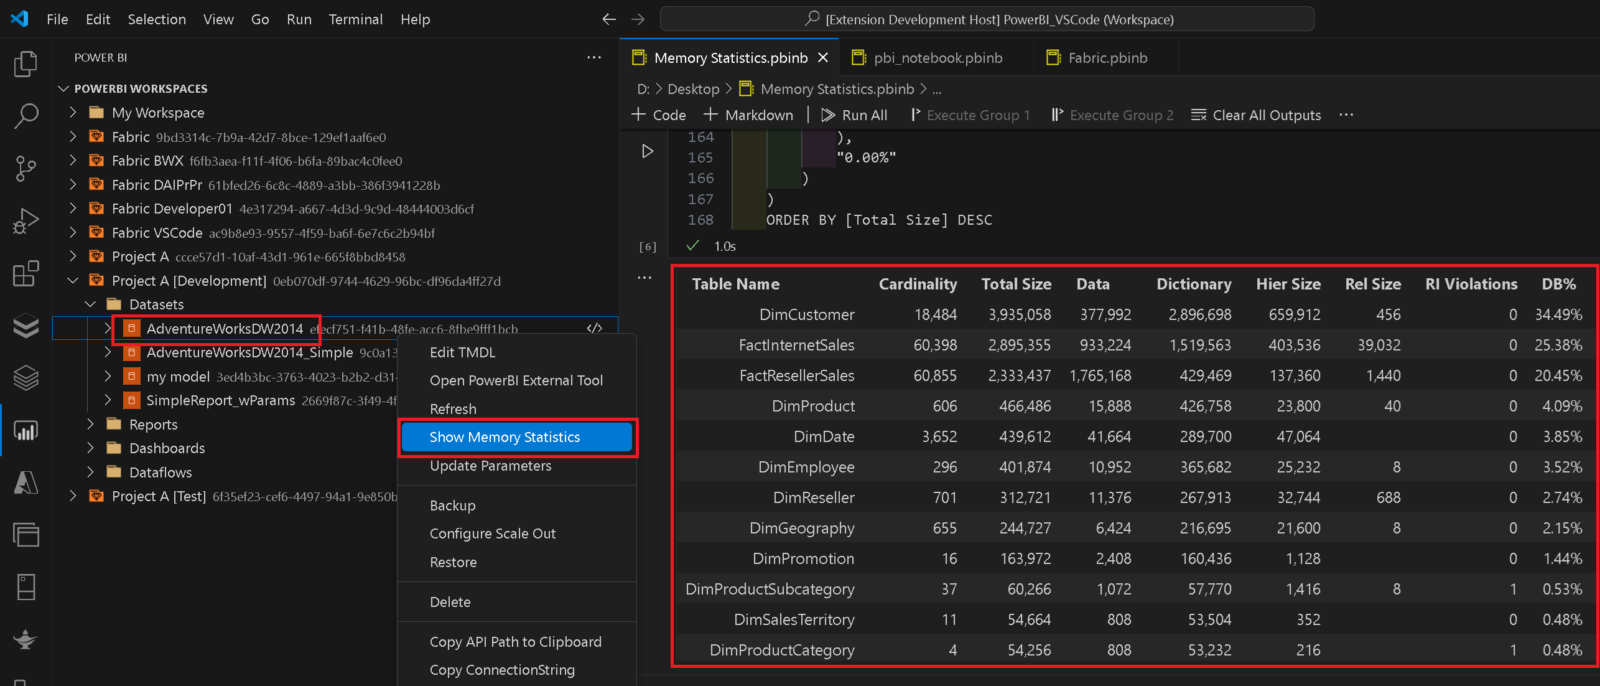
The workspace browser gives you an overview of all items that currently exist in your workspaces. This includes all items that currently exist and automatically extends to new items that might get added in the future. For selected items specific entries in the context menu were added e.g. Copy SQL ConnectionString, Run Notebook, …
There is also a common set of actions that exist for every item like opening the selected item directly in the Fabric Service via your browser or copy its ID or Name.
At the top you will find icons that allow you to filter the list of workspaces, refresh the current item, edit the items (e.g. semantic models, pipelines, … see below) or open a notebook that allows you to run arbitrary calls against the Fabric REST API.
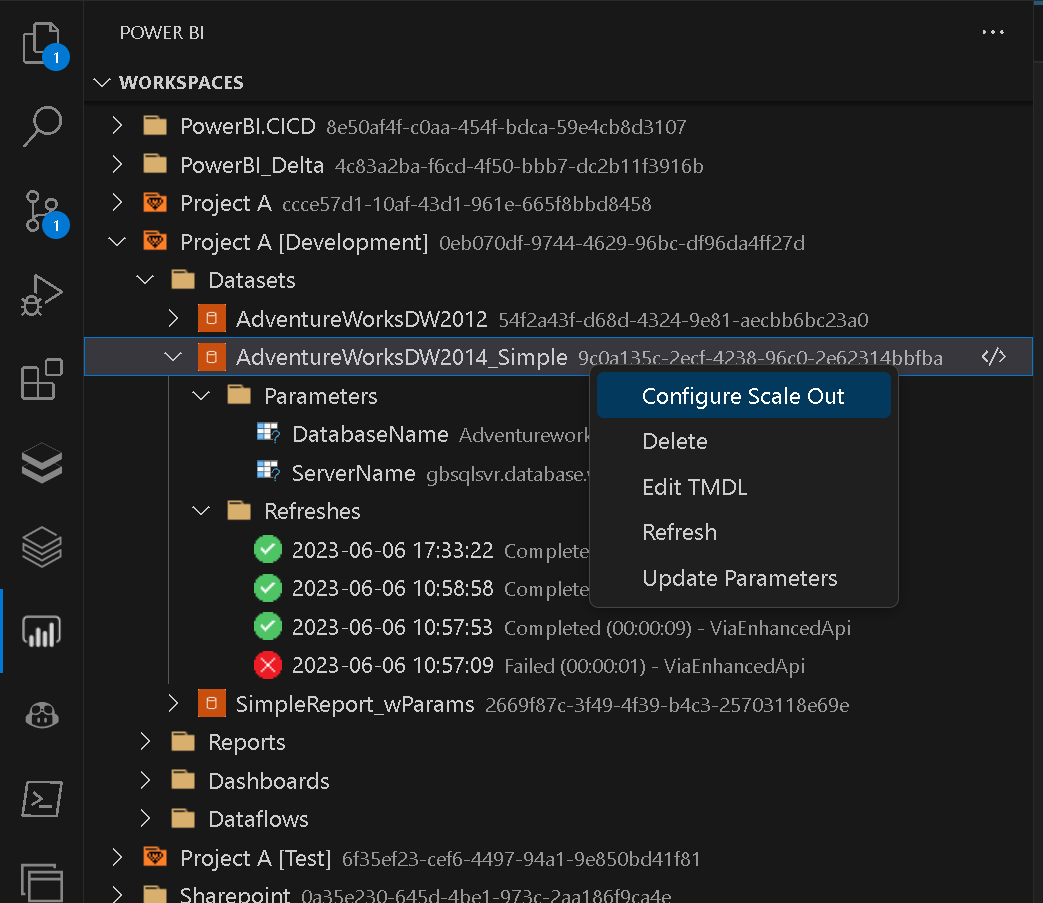
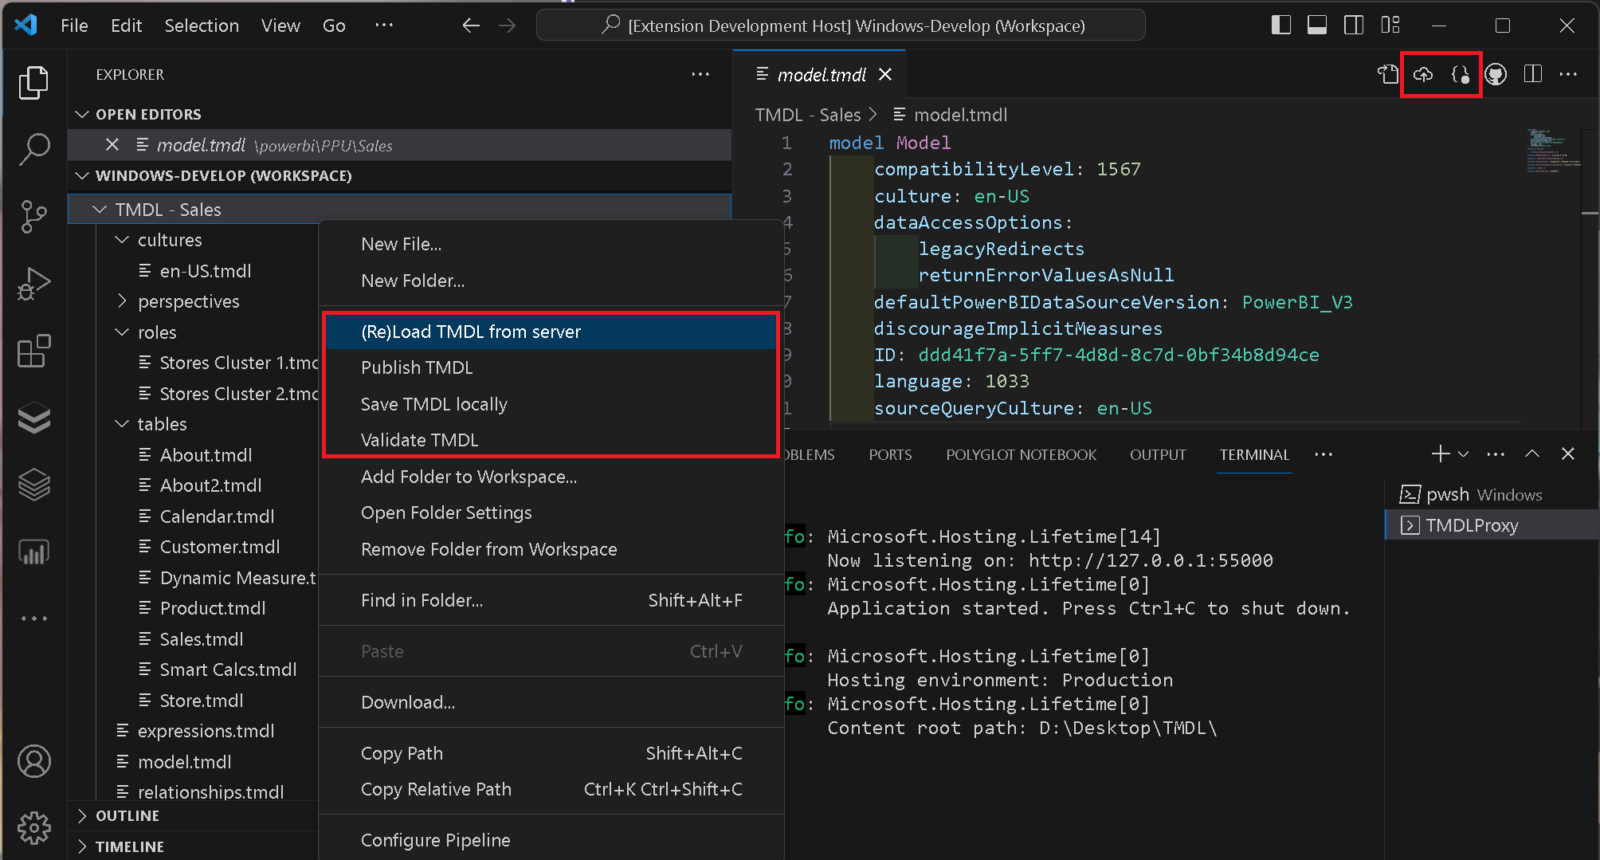
Edit Fabric Items from VSCode
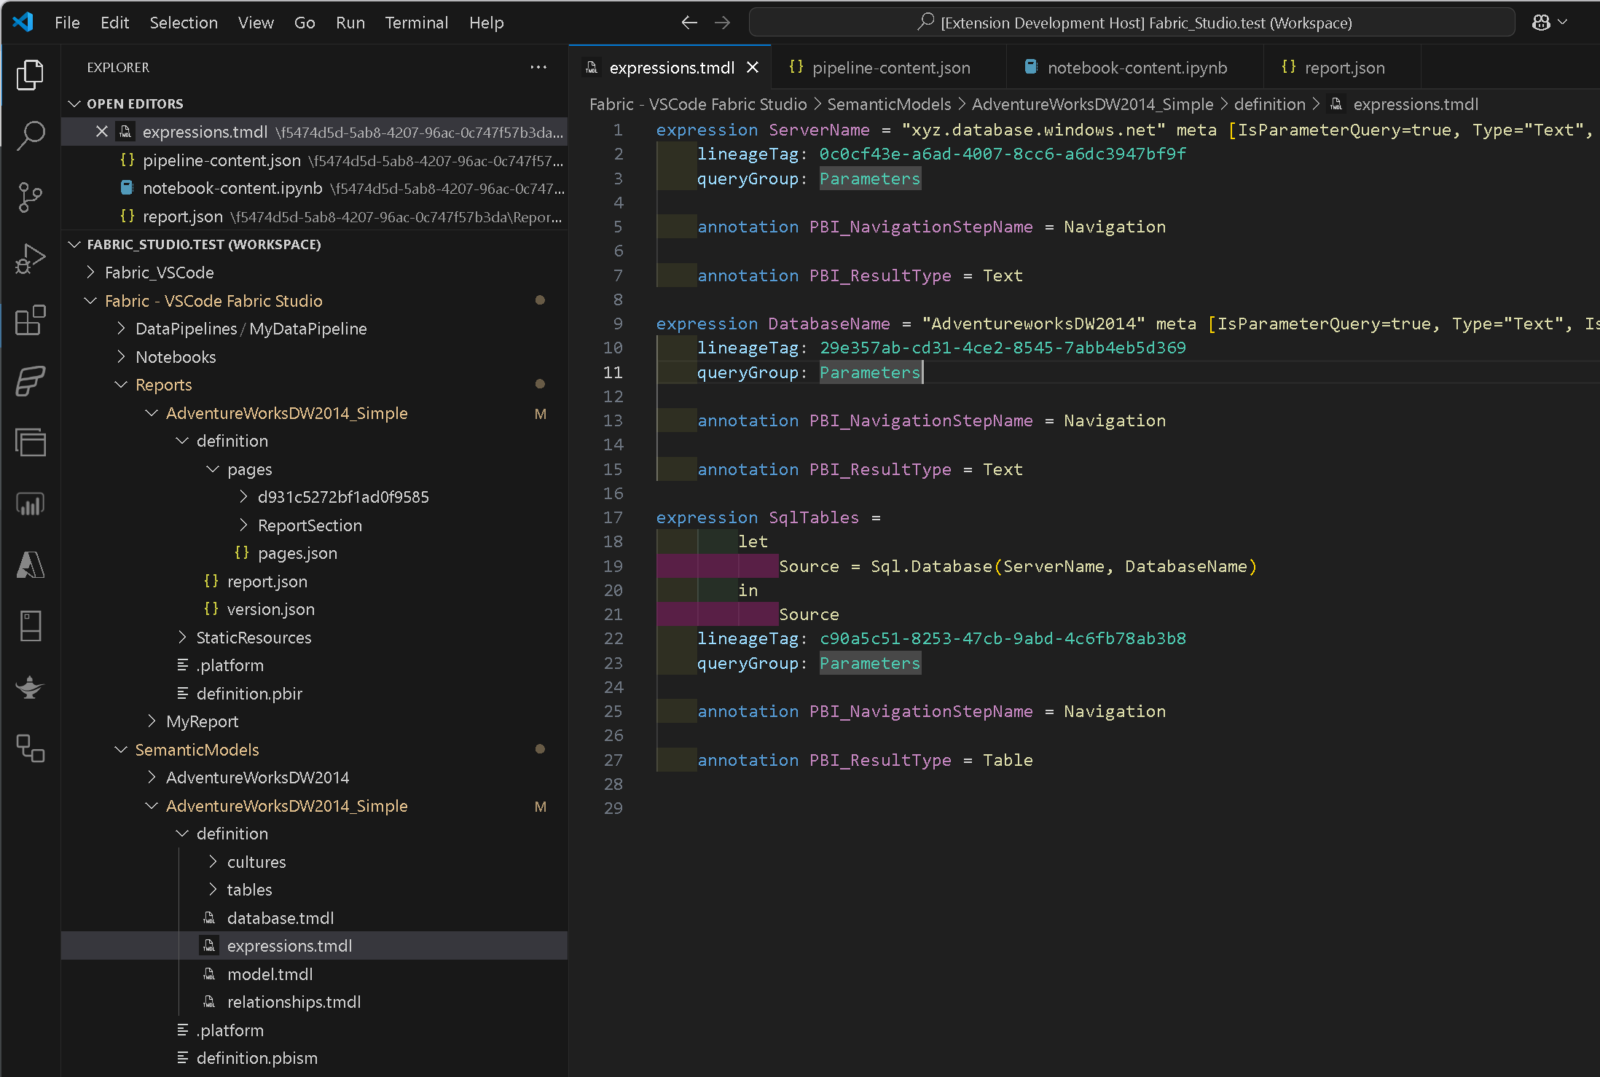
Using the context menu in the Workspace Browser you can select Edit Items which will open the definition of the selected item in your VSCode Solution Explorer as a new folder. You can either do this on the workspace level, a specific item type folder (Pipelines, Notebooks, …) or on an individual item. As of now, not all items are supported – here is a list of items that are supported as of now:
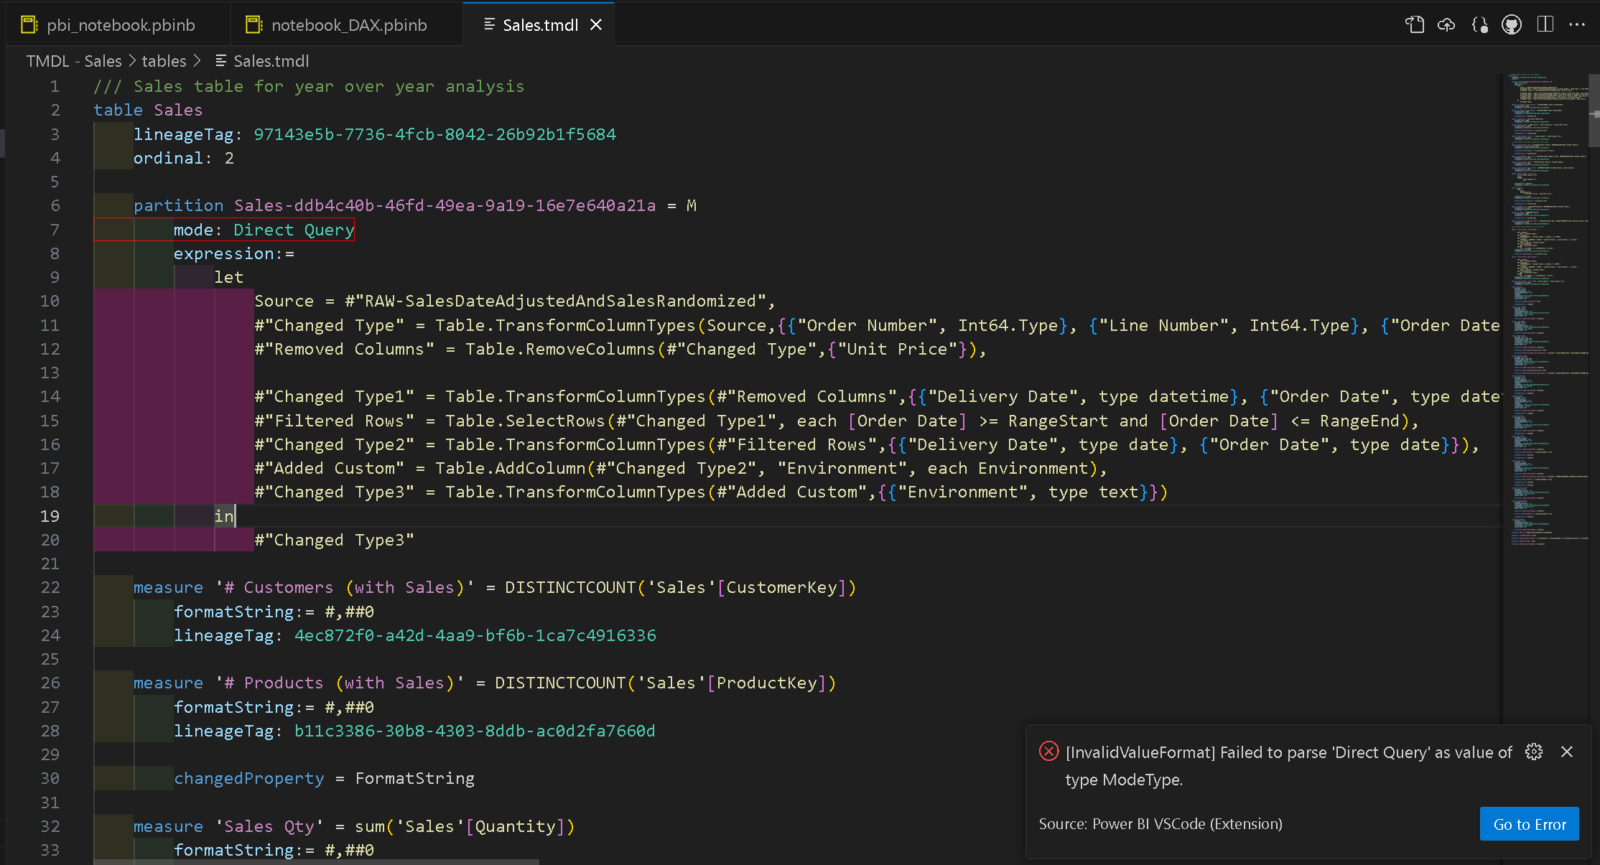
- Semantic Models using TMDL (.tmdl)
- Reports using PBIR (.json)
- Data Pipelines using JSON (.json)
- Notebooks using Python (.py) or Jupyter Notebooks (.ipynb)
- Spark Job Definitions using JSON (.json)
- Mirrored Databases using JSON (.json)
- …
This feature is implemented using VSCode Custom File System providers which makes it behave as if it were a local file system. This means you can also copy&paste or drag&drop between Fabric and your local file system – in both directions! The use-cases are unlimited here:
- easily copy a semantic model or report from one workspace to another
- upload the report of a local PBI Project (.pbip) to Fabric without having to also publish and overwrite the dataset
- do bulk-edits on your notebooks or pipelines
- …
Once you are done with your changes, you can use “Publish to Fabric” to upload them back to Fabric and make the new version available to your users.
Deployment Pipelines
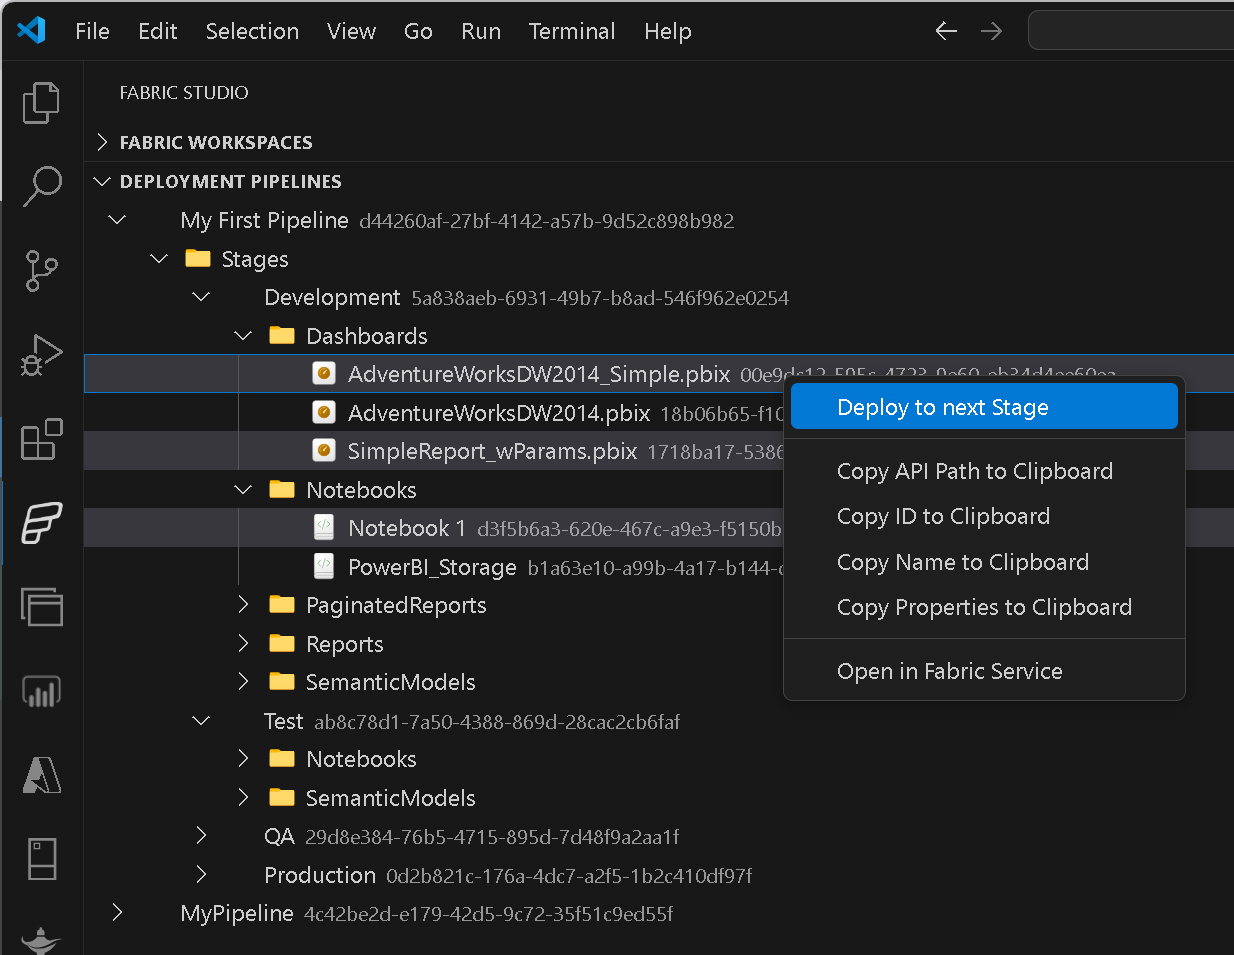
Selectively deploy individual items or whole item types (multi-select!)into the next stage directly from VSCode.
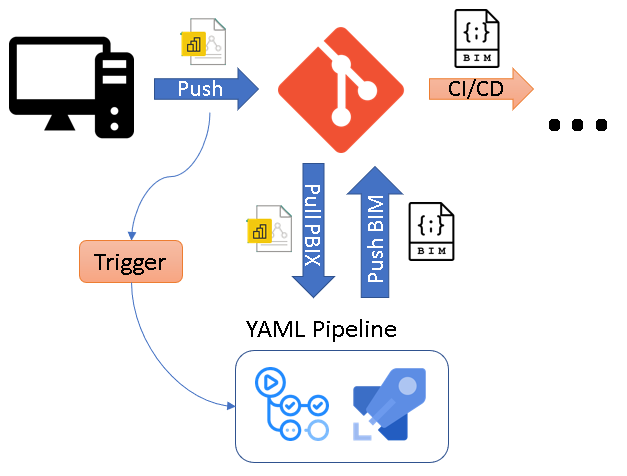
Fabric Git Integration
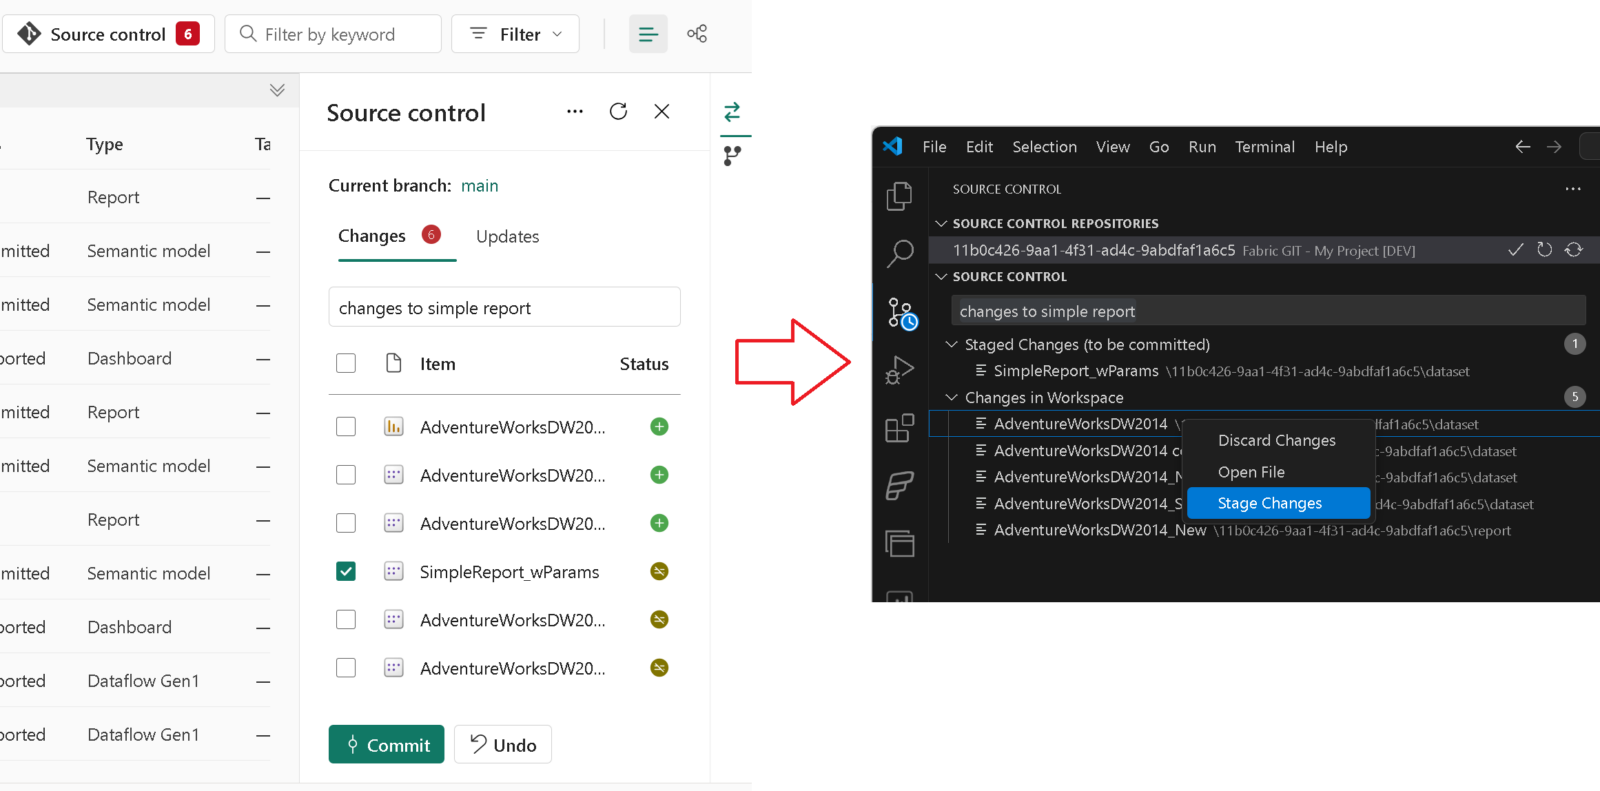
If your Fabric workspace is linked to GIT, you can now mange it from VSCode as if it were a local repository. Stage/Unstage/Discard changes or pull the latest changes from the underlying GIT repository.
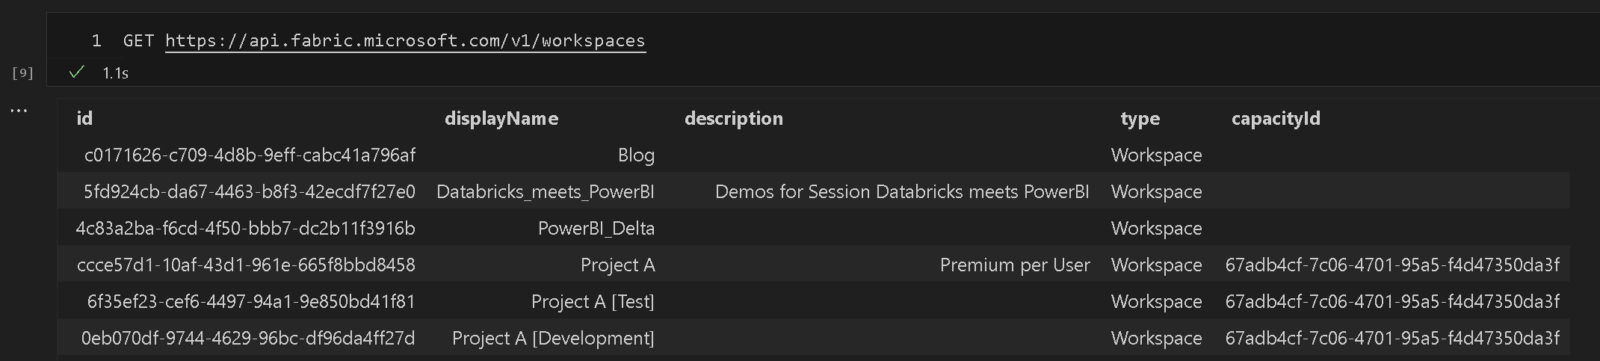
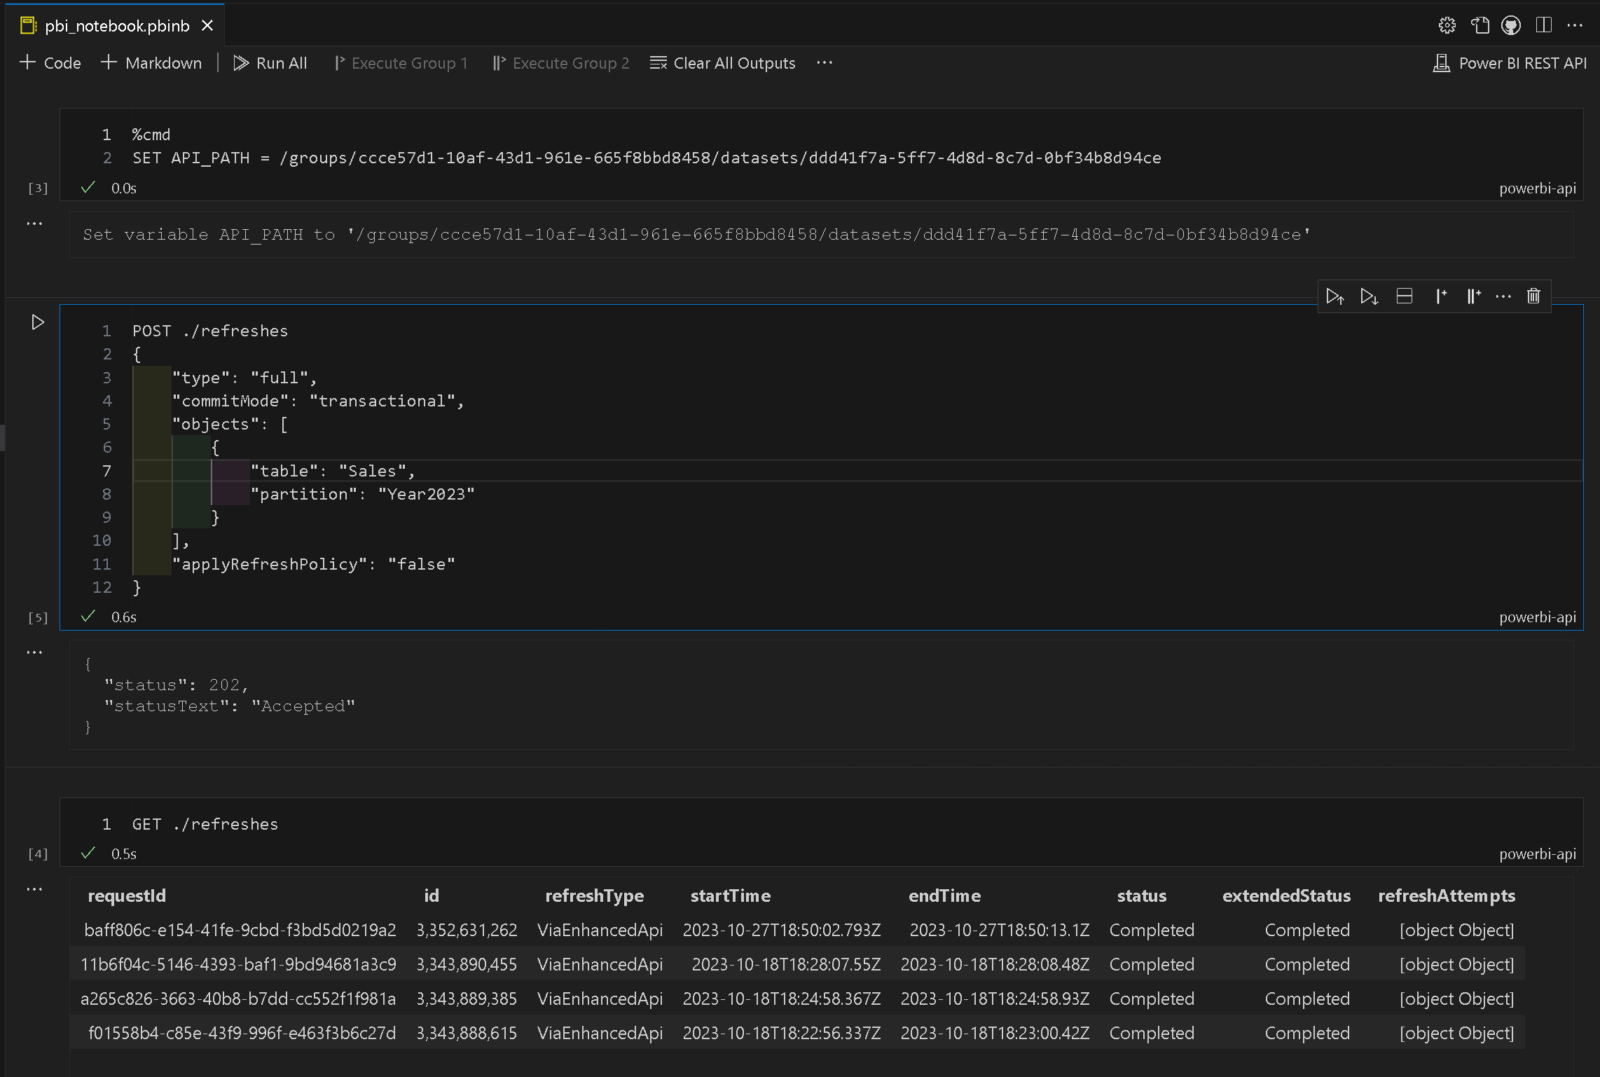
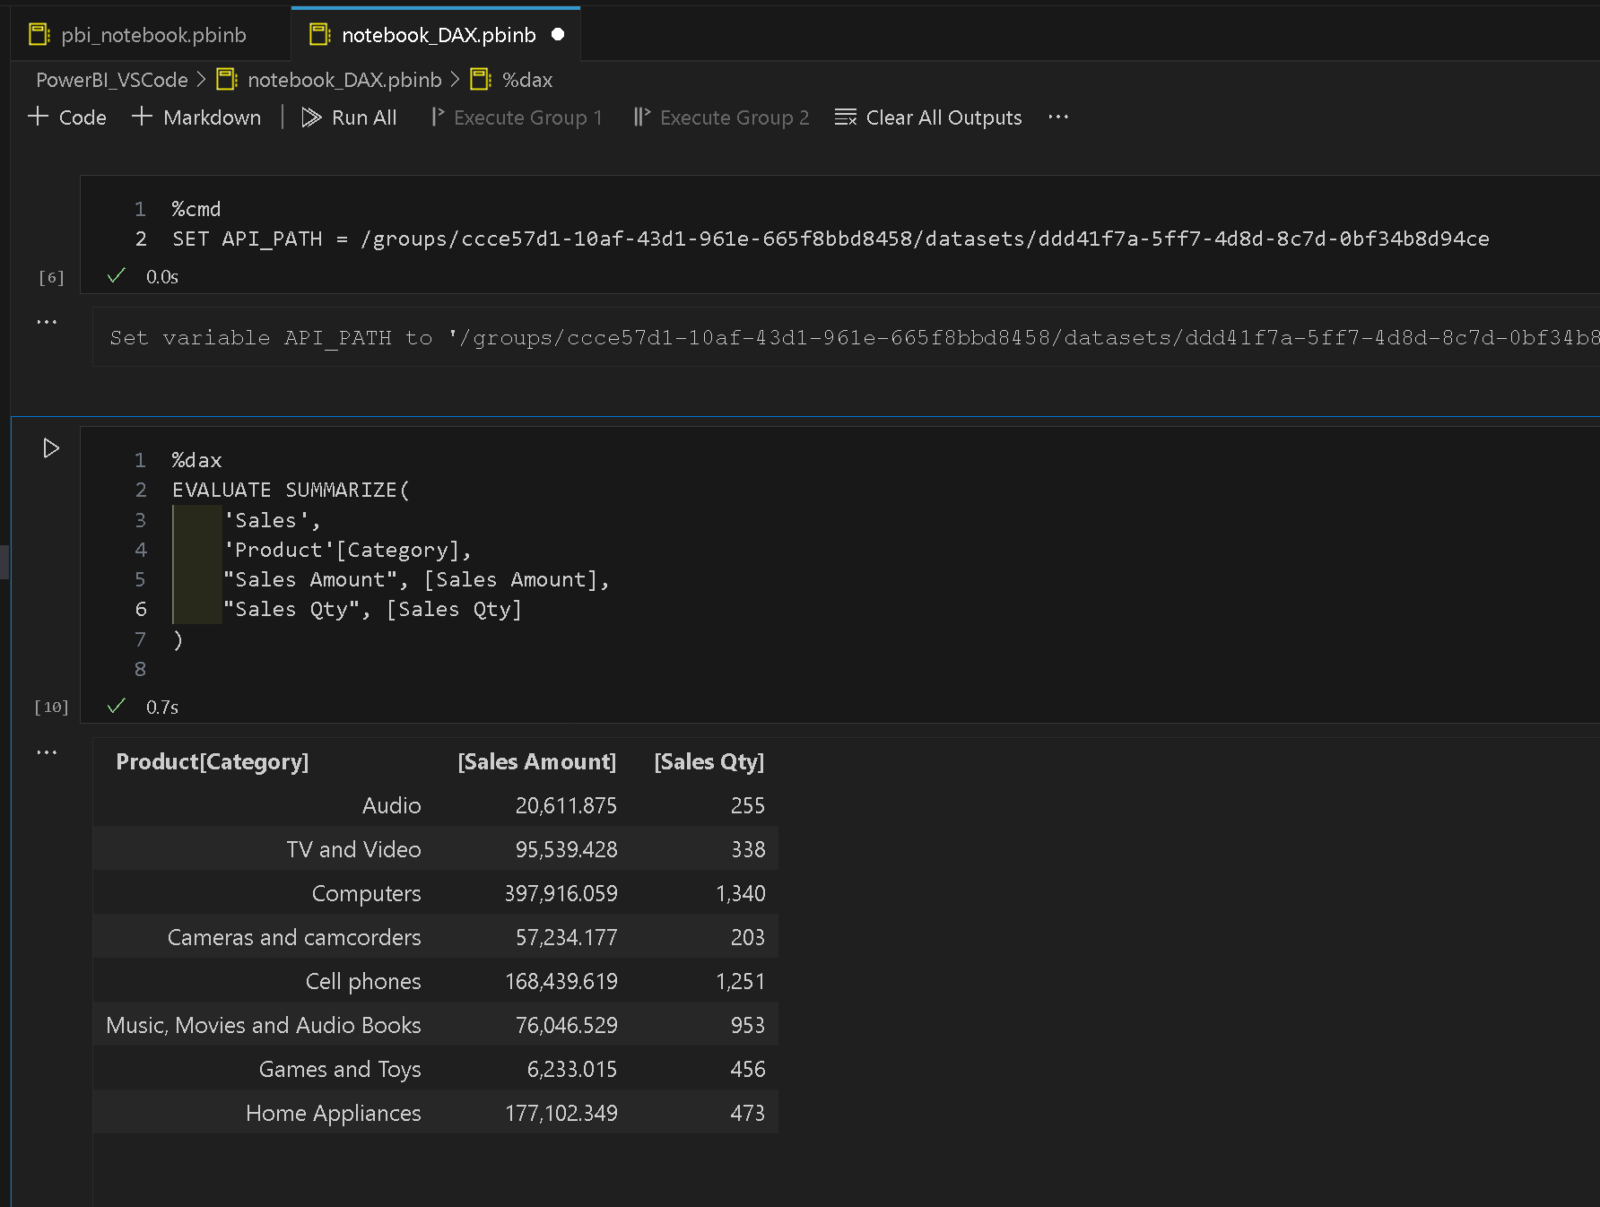
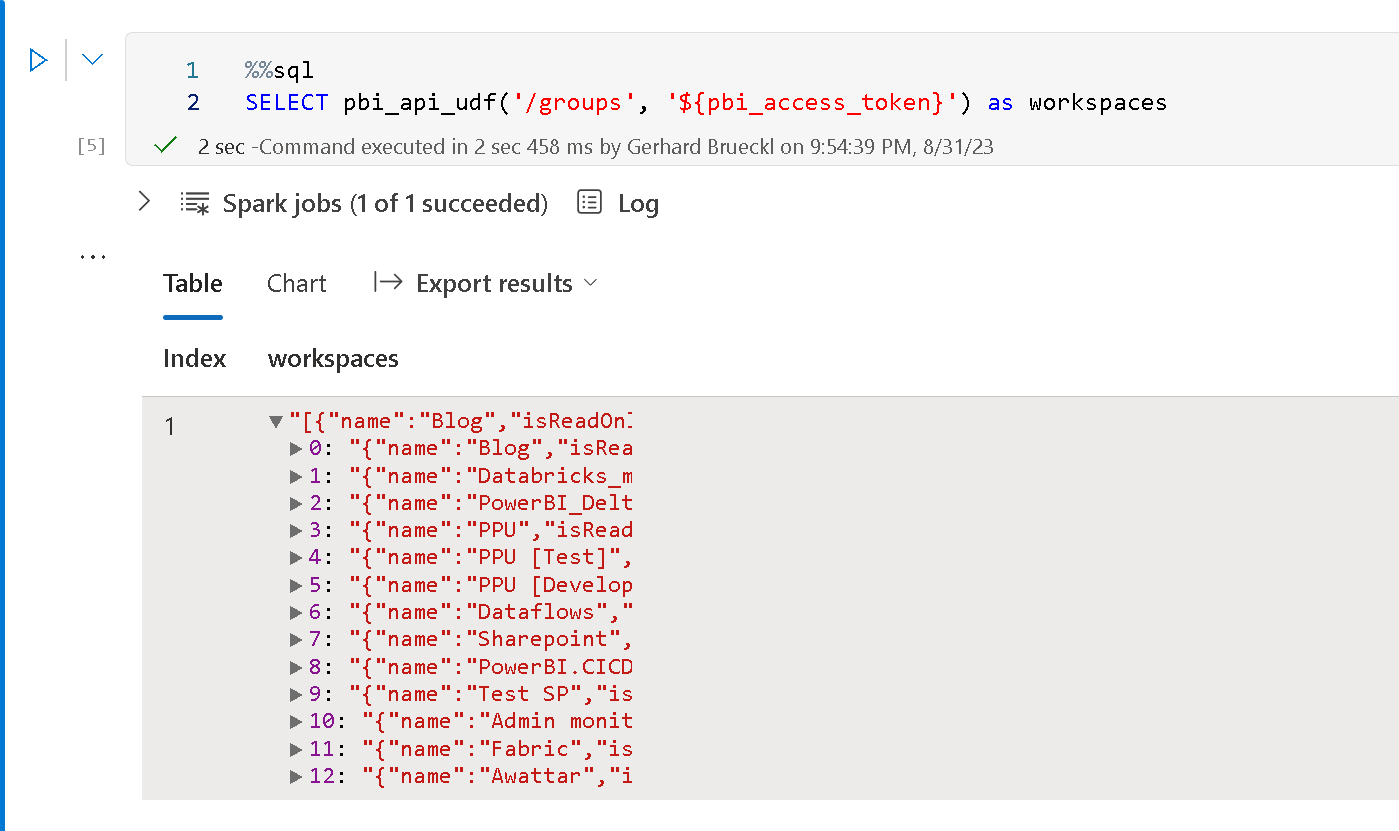
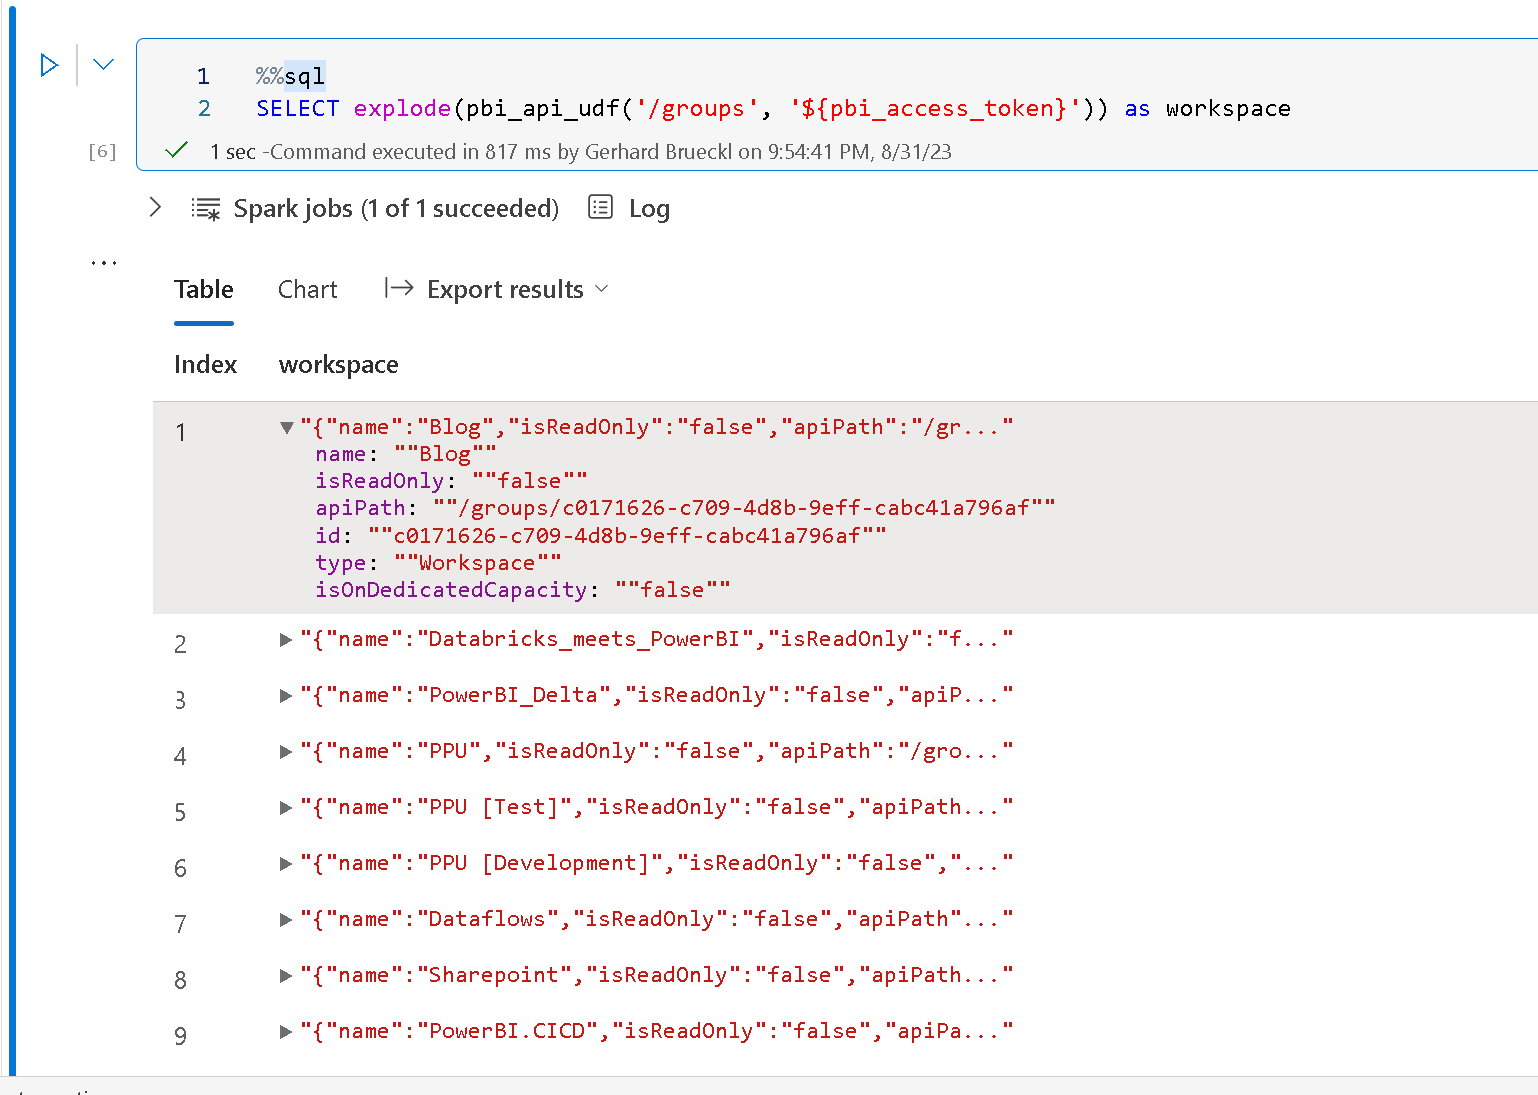
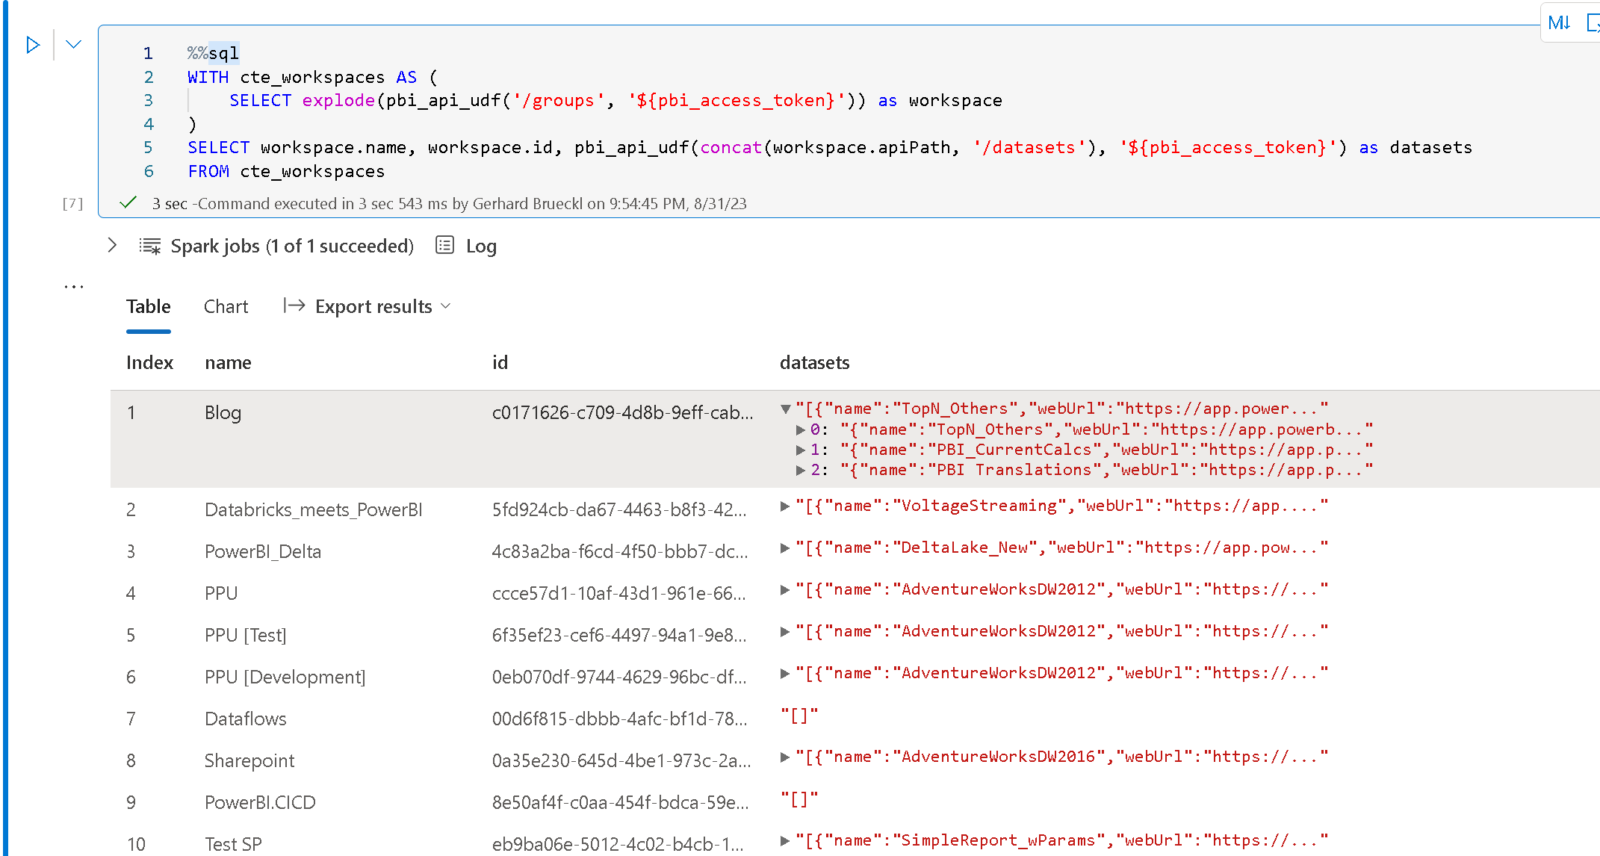
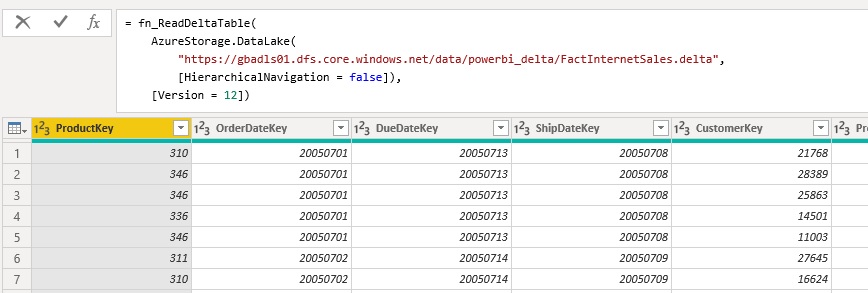
Fabric API Notebooks
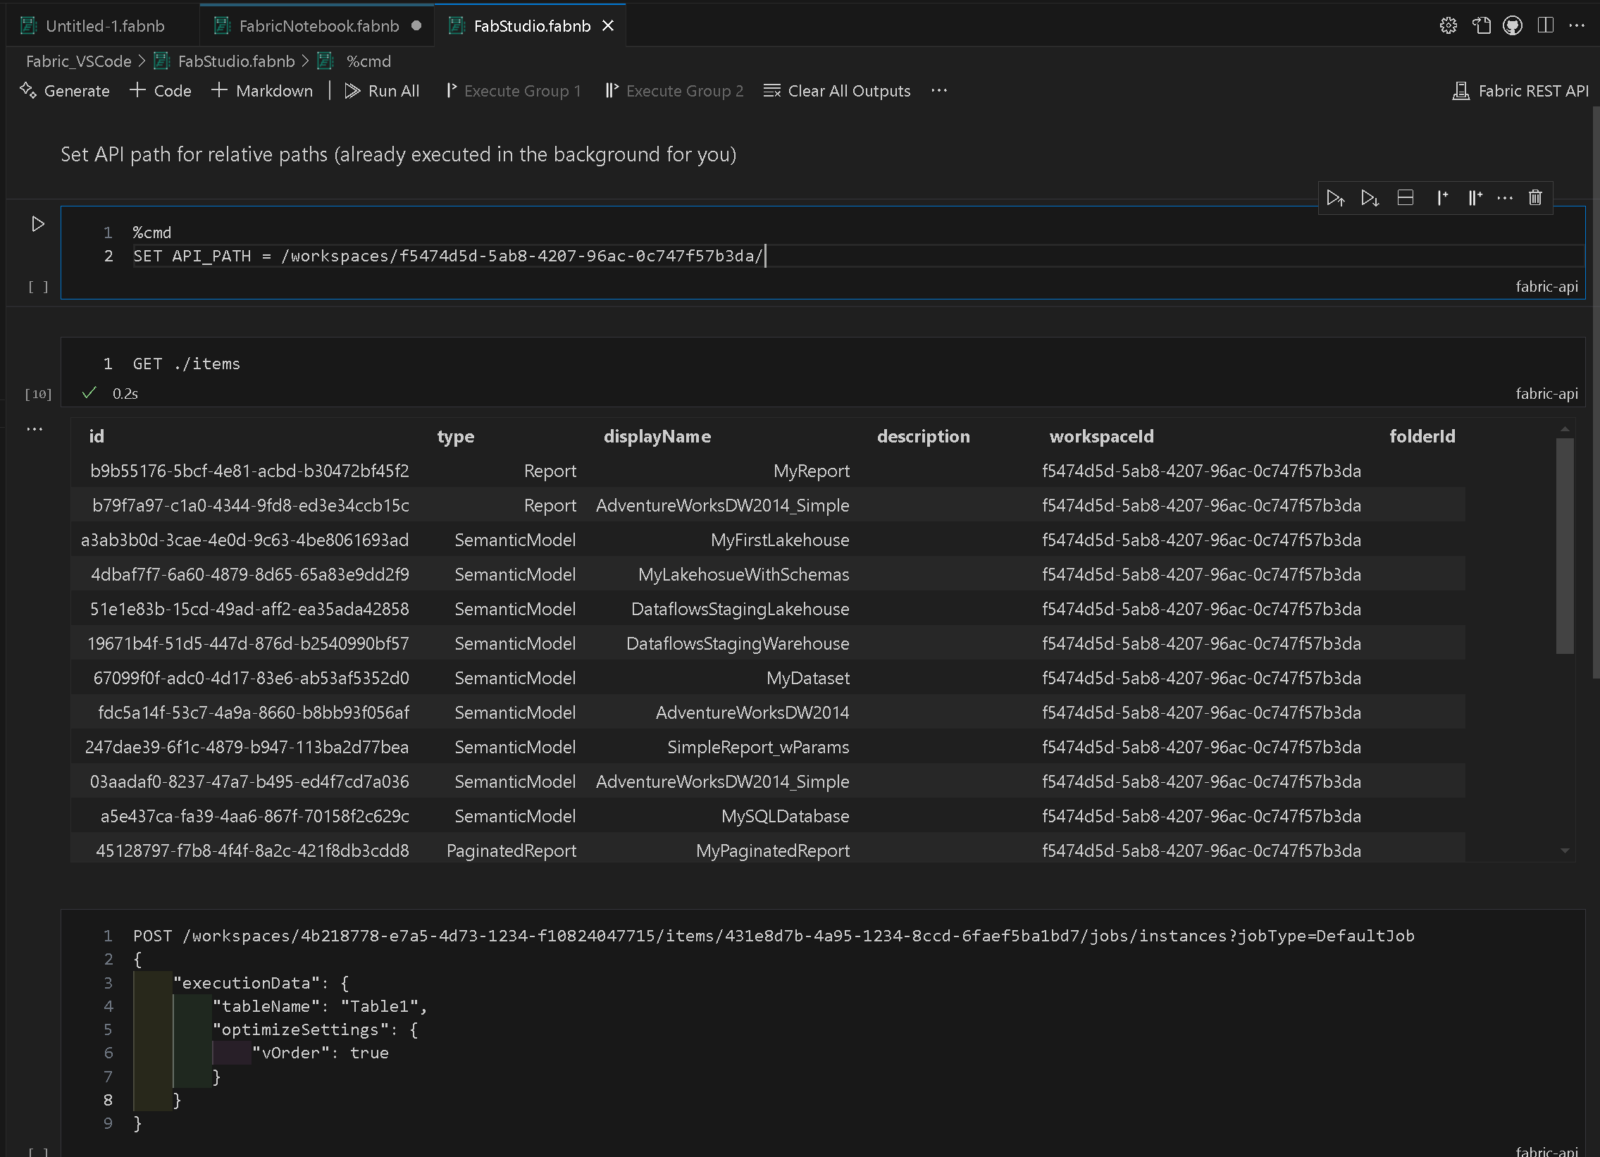
As Fabric Studio is solely based on the REST APIs provided by Fabric, I also wanted to offer a way to make running arbitrary API calls as easy as possible. The main problem when it comes to REST APIs is always authentication. As the API is already authenticated in the background, we can use the same mechanisms to also run any other API calls as well. Notebooks in VSCode offer an intuitive way to to do this. Another reason for this generic way of doing API calls is that not all endpoints will be covered by the UI so it just made sense to offer this option as well.
There would be a lot more features worth being mentioned here but instead I will create short demo videos and publish them via my social media channels (Bluesky, X/Twitter, LinkedIn). So to stay up-to-date with the most recent developments, make sure to also follow me there!
The last thing I want to mention is that the whole project is 100% open source and can be used under the MIT license. The repository is currently hosted in my GitHub account: https://github.com/gbrueckl/FabricStudio. If you are interested in the project and maybe want to contribute to it, please reach out to me!
If you like Fabric Studio but are working mainly with Power BI, make sure to also check out Power BI Studio – another extension developed by me, specifically tailored towards Power BI developers and admins!