When working with Spark or data engineering in general in Microsoft Fabric, you will sooner or later come to the point where you need to reuse some of the code that you have already written in another notebook. Best practice is to put these code pieces into a central place from where it can be referenced and reused. This way you can make sure all notebooks always use the very same code and it is also easy to develop, update and test the common functions.
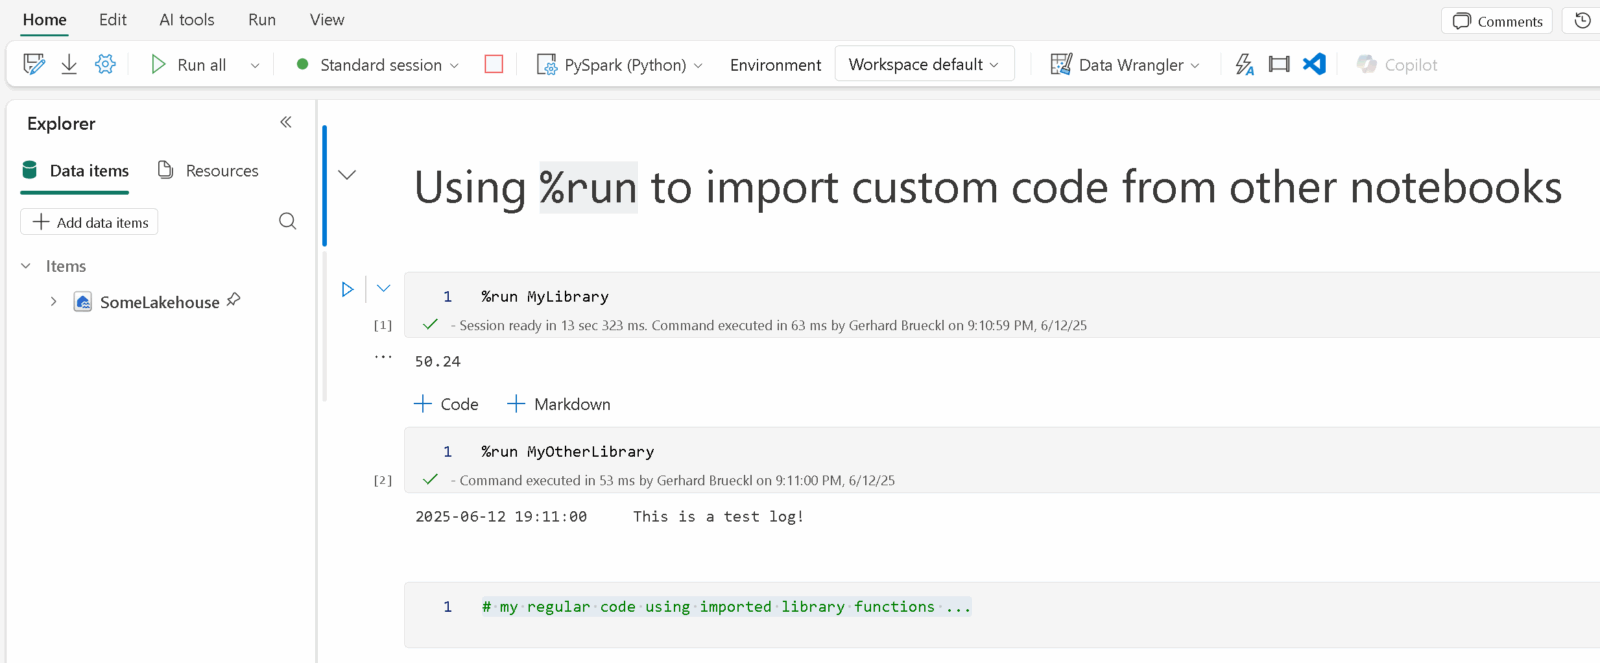
The first thing you would usually end up putting the common code in a dedicated notebook – lets call it MyLibrary%run MyLibraryutils%run and if the referenced notebooks get very long. Also, at some point you will realize that the performance suffers with the amount of code you import this way.
However, the nice thing about this approach is that you can develop your utils/library side-by-side with your notebooks and you do not need any external tools to manage your library which, especially for data engineers with little software engineering background, is a big plus as they do not need to learn any new tools.
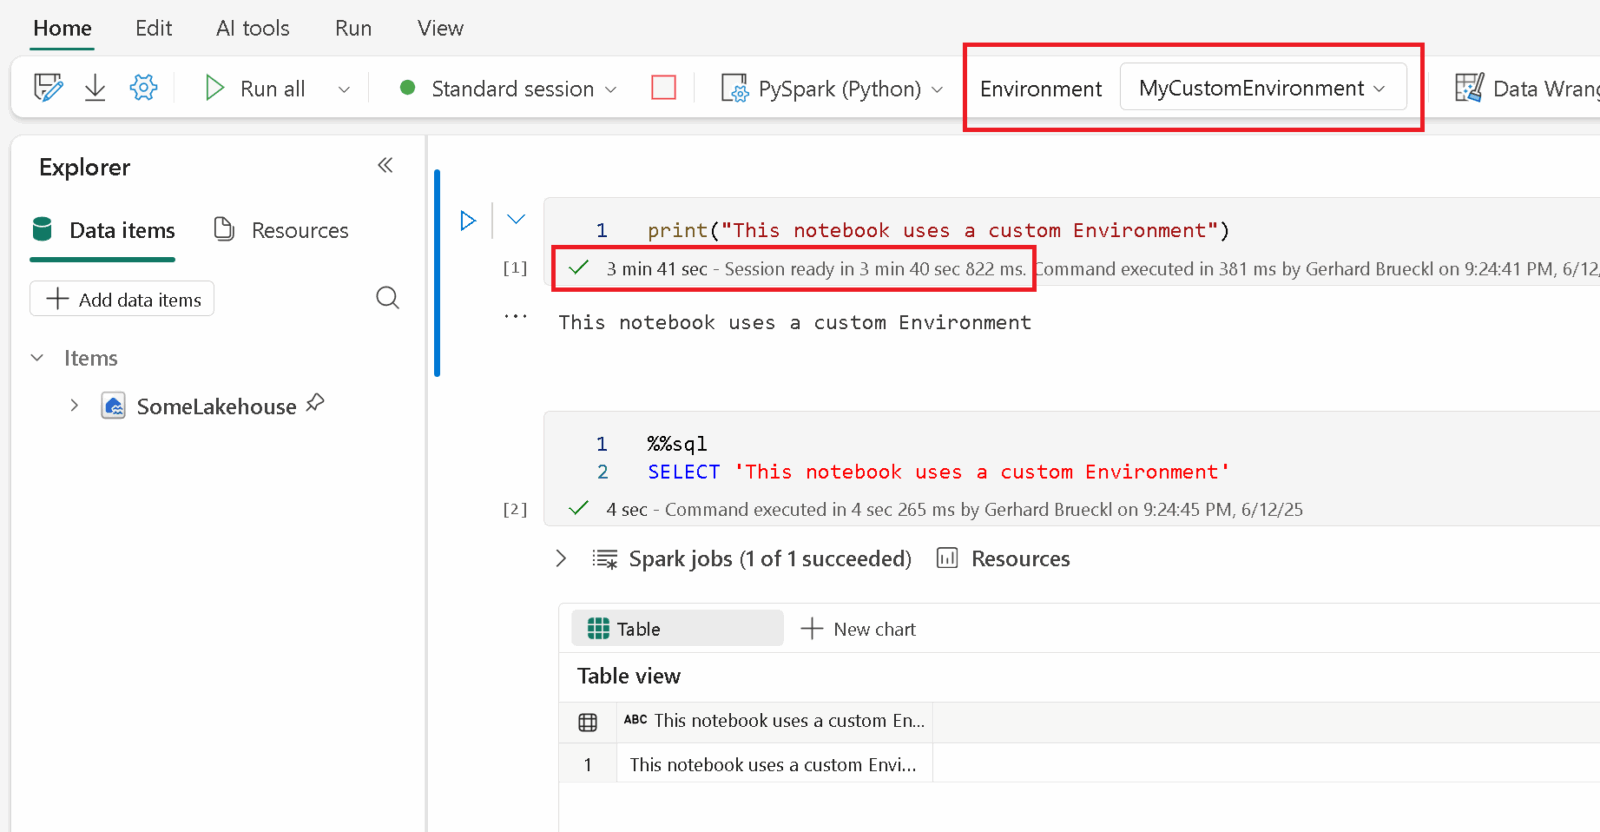
Over time your library will grow and you will look for a “more professional” way to manage your library. That`s where python libraries, packaging and in the end Fabric Environments come into play. Now you are entering the world of software engineering which you may not be very familiar with. While this provides a lot of benefits, its also introduced a lot more complexity and a different way of working – usually outside of Fabric. A .whl file is built outside of fabric and uploaded and attached to an Environment in Fabric. Your notebooks then reference this Environment and inherit all settings from there instead of the Starter Pool.
As you can imagine, this also has some drawbacks which you should be aware of before going down this path:
- You need to attach your notebooks to an environment
- notebooks attached to a custom environment will suffer from a longer cluster startup
- whenever you change code in your library, you need to build it, publish it, attach it to your environment and restart the kernel of the notebook that consumes it
This will significantly increase the development time for your regular notebooks, especially if you are still constantly changing or extending the library. Updating an existing environment just took about 15 minutes(!) + the increased cluster startup time. All in all not really great if your library is still in an early stage and changes frequently.
SparkContext to the rescue!
Fortunately, there is another way too which is not specific to Microsoft Fabric but a feature of Spark in general: SparkContext.addPyFile()
This function allows you to inject custom Python/PySpark code into your current Spark context. The code file – a .py or .zip file – can reside anywhere as long as it is accessible from the Spark cluster. The typical file storage within Microsoft Fabric would be the /Files section of a lakehouse which can be used in any notebook.
Now here is what we want to achieve:
- develop notebooks and library code side-by-side within Microsoft Fabric
- no use of external tools (offline or online)
- quick iteration cycles when developing the library
- avoid Environments due to longer cluster startup times
- updates to the library should not require any further changes in existing notebooks

To accomplish this, I have created a generic notebook which I call LibraryManager. It allows you to define a set of notebooks which should be used and bundled into a library. The LibraryManager uses the Fabric REST API to download those notebooks as .py files into a lakehouse, compresses them into a .zip file and generates another notebook (load_LibraryManager) that then imports this .zip file using sc.addPyFile(). The notebooks that need to use your library can then simply use %run load_LibraryManager to import all the common code defined in your library. If the library evolves, the new functions will be available in all notebooks immediately without any further todos.

To make changes to the code in the library, I can now simply open the respective notebook in Fabric, and change the code as necessary. Then manually I run the LibraryManager notebook which only takes a couple of seconds to finish. Last but not least I restart the kernel of the referencing notebook and run it again which will load the most recent version of the library that I just updated. All-in-all this takes about 10 seconds and I do not need to leave Fabric.
Another nice aspect of this is that your library is now also part of your git repository and you always have a consistent state of notebooks and libraries and no dependency hell. The only thing you need to do is to run the LibraryManager notebook after each new deployment to make sure the library in the Lakehouse is up-to-date.
Now some people will argue that this is not professional and a library should have unit and integration tests and some proper versioning and release cycles and so on and so forth. And yes, you are right, for enterprise scale projects, that’s definitely the way to go! But if you only need a way to manage and share common code used in your data pipelines, this can still be a very good alternative with a low entry point and providing rapid development cycles and iterations not blocking you in any way and giving you a lot of flexibility.
Let me know what you think in the comments!
The LibraryManager notebook and a small sample of this can be found in my public github repository Fabric.Toolbox