A very common requirement for a Power BI report that I stumble across at almost all of my customers is to automatically show data for the current day/month/year when a report is opened. At first sight this seems like a very trivial problem but once you dig into the problem, you will realize that all of the common solutions out there have some disadvantages and only solve the problem partially.
So here is what we want to achieve:
Show the Current Month (or Day, or Year) by default
Works [in combination] with all other columns in the date table.
A single, easy to use slicer/filter to control the time selection and change from Current Month/Day/Year to any other value
Works with built-in time intelligence functions
Works with existing DAX measures
Works with any datamodel/report
Solutions like Relative Time Filter/Slicer, DAX or relative flags in the date table address only some points of the above list but definitely not all of them which is why I thought we need a better solution to this:
(please use full-screen mode)
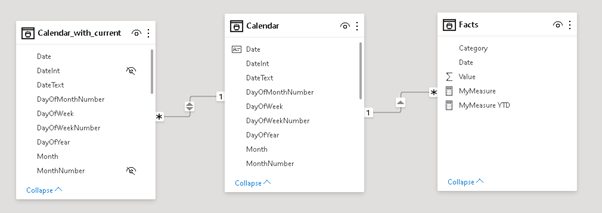
We actually created a new table in our data model that is linked to the original date table. The reason why we cannot use the same table here is that the new table does not have unique date values as all dates/rows referring to our current calculations are duplicated. It has to be a many-to-one relationship with cross-filter direction set to both (even though we will only use the new table ‘Calendar_with_current’ to filter the existing table ‘Calendar’):
And that’s it basically. You can now exchange the original Calendar table with the new one to get the new “Current” values in your report. If you have time intelligence functions in place, you further need to extend them and add ALL('Calendar_with_current ') as a filter to make them work also with the new table. The old table can also be hidden now if you do not want to confuse the end users. To make a seamless switch you can further rename the tables.
I added an additional column to the table called Type that allows you to select which values you want to show – the original values (e.g. “September”), the values with “Current X” (e.g. “Current Month”), or both.Please see the second page/tab of the embedded report above.
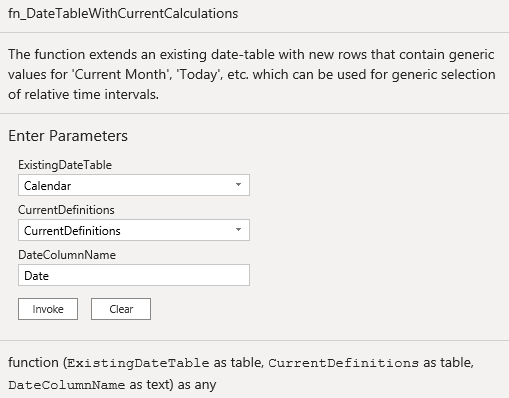
So this raises the question how this new table can be created? To simplify this I have created a Power Query function that takes 3 parameters:
The current date table
A list of definitions of your current-values
The name of the unique date-column in your current date table (parameter 1)
The first and the third parameter should be clear, but what are the “CurrentDefinitions”?
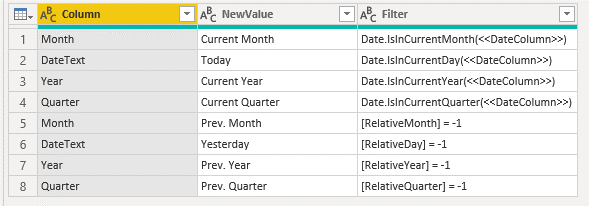
It is basically a table which defines the relative time calculations that you want to extend your existing date table with. Here is an example:
The column Column refers to the column in which you want to create the relative date definition. The column NewValue specifies the value that you want to set for rows that match the third column Filter. The column Filter either takes a static filter expression like [RelativeMonth] = 1 (as in lines 5-8) but can also use existing M-functions and reference the existing Date-column using the placeholder <<DateColumn>> as you can see in lines 1-4.
The table can be maintained using “Enter Data” and can contain any number of rows/definitions!
For most of my scenarios this works pretty well and addresses all major problems highlighted above.
When working with Power Query, you have probably already realized that every expression you write returns a value of a specific type. Usually this will be a primitive type like text, number, or date. (A full list of types available in Power Query can be found here: https://docs.microsoft.com/en-us/powerquery-m/m-spec-types). If for some reason the type of an expression cannot be defined, the special type *any* will be used. For sure you already encountered this when using Table.AddColumn which, by default, results in the new column being of type *any*.
To avoid this, you can use the optional fourth parameter and specify the resulting type of the expression. This can be very handy and saves you the Change Type step that usually comes afterwards.
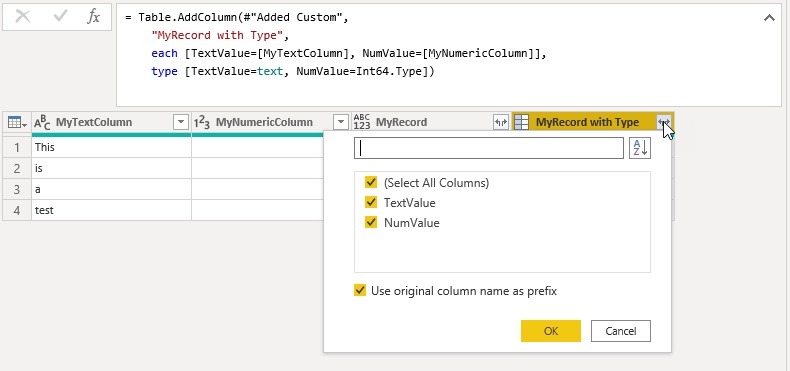
This fourth parameter not only works for primitive types but also for complex types. If you do not specify it, the column type is again *any* even though the actual values are records:
Once you click the Expand-Button of the new MyRecord column in the table header, you will realize a short delay until the available fields are displayed. This indicates that PQ first has to evaluate the expression before it can provide you the list of fields within the record. For complex scenarios, this can take a long time and can also be avoided by explicitly specifying the type in the fourth parameter as shown below:
As you can see, PQ can now immediately display the available columns without having to evaluate the function!
This also works the very same way if you call a custom function as expression of your Table.AddColumn. But there is the caveat: If you have a function that returns a complex type, let’s say a record, you will usually want to specify the type as part of the function or within the definition of the function and not re-type it again each time you call the function.
Fortunately, there is a solution to this problem: the function Type.FunctionReturn. In combination with Value.Type you can derive the return type from the function dynamically!
So, if you have the following function:
let
    myTextFunction = () as text => "Called fn_myTextFunction!"
in
    myTextFunction
You can derive the resulting type of the function by using a combination of Type.FunctionReturn and Value.Type as shown below:
Ok, so this is already pretty cool – but what happens if your function returns a complex type like a record or a table?
You will realize that you can simply replace “as text” with “as record” and the function would now return a record – at least logically, you also need to change the actual expression:
let
    myFunction = () as record => [MyText="Called fn_MyTextFunction!"]
in
    myFunction
and then call it as before:
You will realize that now again it takes some time until the available fields are displayed indicating the function must be evaluated first. Another indicator for this to happen is the warning at the bottom and the link to “Load more”. If you think of it, this makes sense – Power Query knows that the function now returns a record, but does not know which fields the record contains and thus has to evaluate it. So how can we combine custom function that return complex types and the ability to specify the resulting type as part of the function?
The first thing that would come to your mind is to simply strong-type the return type of the function specifying each field individually, but this will result in an error:
Currently it is not supported to specify a complex type as the return type of a function – it only works with primitive types. But as you can guess, I did not start this blog post for no reason. There is a way to achieve this, even though it may not be as nice as it could and should be.
The solution here is the Type.ForFunction function which allows you to create a more specific definition of your function including the return type. This definition/type can then be applied to your original function using Value.ReplaceType:
let
    resultType = type [TextValue=text, NumValue=number],
    myFunction = (myText as text, myNum as number) => [TextValue=myText, NumValue=myNum],

    parameters = Type.FunctionParameters(Value.Type(myFunction)),
    requiredParameters = Type.FunctionRequiredParameters(Value.Type(myFunction)),

    newFunctionType = Type.ForFunction([ReturnType = resultType, Parameters = parameters], requiredParameters),

    newFunction = Value.ReplaceType(myFunction, newFunctionType)
in
    newFunction
You basically first define the final return type of the function and the function itself (lines 2 and 3). The other lines (5 to 10) take care of applying the return type to the function which can then be used in combination with the approach above to dynamically derive the return type when calling the function (using ype.FunctionReturn and Value.Type). This now allows you to specify everything that is related to the function in one place!
This is especially handy if you have a function that returns a record or a table which is re-used multiple times and the fields/columns may change over time. Using this approach allows you to only change the function and everything else is derived automatically.
I also contributed the connector described in this post to the official delta.io Connectors page and repo (link). You will find the most recent updates in my personal repo which are then merged to the official repo once it has been tested thoroughly!
Working with analytical data platforms and big data on a daily basis, I was quite happy when Microsoft finally announced a connector for Parquet files back in November 2020. The Parquet file format is developed by the Apache foundation as an open-source project and has become a fundamental part of most data lake systems nowadays.
“Apache Parquet is a columnar storage format available to any project in the Hadoop ecosystem, regardless of the choice of data processing framework, data model or programming language.”
However, Parquet is just a file format and does not really support you when it comes to data management. Common data manipulation operations (DML) like updates and deletes still need to be handled manually by the data pipeline. This was one of the reasons why Delta Lake (delta.io) was developed besides a lot of other features like ACID transactions, proper meta data handling and a lot more. If you are interested in the details, please follow the link above.
So what is a Delta Lake table and how is it related to Parquet? Basically a Delta Lake table is a folder in your Data Lake (or wherever you store your data) and consists of two parts:
Delta log files (in the sub-folder _delta_log)
Data files (Parquet files in the root folder or sub-folders if partitioning is used)
The Delta log persists all transactions that modified the data or meta data in the table. For example, if you execute an INSERT statement, a new transaction is created in the Delta log and a new file is added to the data files which is referenced by the Delta log. If a DELETE statement is executed, a particular set of data files is (logically) removed from the Delta log but the data file still resides in the folder for a certain time. So we cannot just simply read all Parquet files in the root folder but need to process the Delta log first so we know which Parquet files are valid for the latest state of the table.
These logs are usually stored as JSON files (actually JSONL files to be more precise). After 10 transactions, a so-called checkpoint-file is created which is in Parquet format and stores all transactions up to that point in time. The relevant logs for the final table are then the combination of the last checkpoint-file and the JSON files that were created afterwards. If you are interested in all the details on how the Delta Log works, here is the full Delta Log protocol specification.
From those logs we get the information which Parquet files in the main folder must be processed to obtain the final table. The content of those Parquet files can then simply be combined and loaded into PowerBI.
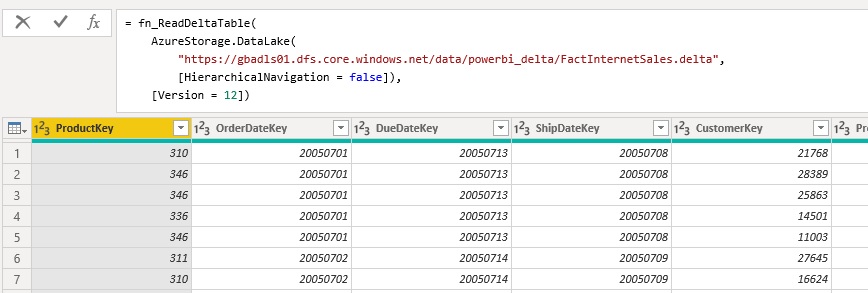
I encapsulated all this logic into a custom Power Query function which takes the folder listing of the Delta table folder as input and returns the content of the Delta table. The folder listing can either come from an Azure Data Lake Store, a local folder, or an Azure Blob Storage. The mandatory fields/columns are [Content], [Name] and [Folder Path]. There is also an optional parameter which allows you the specify further options for reading the Delta table like the Version if you want to use time-travel. However, this is still experimental and if you want to get the latest state of the table, you can simply omit it.
The most current M-code for the function can be found in my Github repository for PowerBI: fn_ReadDeltaTable.pq and will also be constantly updated there if I find any improvement. The repository also contains an PowerBI desktop file (.pbix) where you can see the single steps that make up for the final function.
Once you have added the function to your PowerBI / Power Query environment you can call it like this:
I would further recommend to nest your queries and separate the access to the storage (e.g. Azure Data Lake Store) and the reading of the table (execution of the function). If you are reading for an ADLS, it is mandatory to also specify [HierarchicalNavigation = false] ! If you are reading from a blob storage, the standard folder listing is slightly different and needs to be changed.
Right now the connector/function is still experimental and performance is not yet optimal. But I hope to get this fixed in the near future to have a native way to read and finally visualize Delta lake tables in PowerBI.
After some thorough testing the connector/function finally reached a state where it can be used without any major blocking issues, however there are still some known limitations:
Partitioned tables
currently columns used for partitioning will always have the value NULLFIXED!
values for partitioning columns are not stored as part of the parquet file but need to be derived from the folder pathFIXED!
Performance
is currently not great but this is mainly related to the Parquet connector as it seems
very much depends on your data – please test on your own!
Time Travel
currently only supports “VERSION AS OF”
need to add “TIMESTAMP AS OF”
Predicate Pushdown / Partition Elimination
currently not supported – it always reads the whole tableFIXED!
Any feedback is welcome!
Special thanks also goes to Imke Feldmann (@TheBIccountant, blog) and Chris Webb (@cwebb_bi, blog) who helped me writing and tuning the PQ function!
As some of you probably remember, when PowerPivot was still only available in Excel and Power Query did not yet exist, it was possible to load images from a database (binary column) directly into the data model and display them in PowerView. Unfortunately, this feature did not work anymore in PowerBI Desktop and the only way to display images in a visual was to provide the URL of the image which is public accessible. The visual would then grab the image on-the-fly from the URL and render it. This of course has various drawbacks:
The image needs to be available via a public URL (e.g. upload it first to an Azure Blob Store)
The image cannot be displayed when you are offline
The link may break in the future or point to a different image as initially when the model was built
Until today I was sure that we have to live with this limitation but then I came across this blog post from Jason Thomas aka SqlJason. He shows a workaround to store images directly in the PowerBI data model and display them in the report as if they were regular images loaded from an URL. This is pretty awesome and I have to dedicate at least 99.9% of this blog post to Jason and his solution!
However, with this blog post I would like to take Jasons’ approach a step further. He creates the Base64 string externally and hardcodes it in the model using DAX. This has some advantages (static image, no external dependency anymore, …) but also a lot of disadvantages (externally create the Base64 string, manually copy&paste the Base64 string for each image, hard to maintain, cannot dynamically add images …). For scenarios where you have a local folder with images, a set of [private] URLs pointing to images or images stored in a SQL table (as binary) which you want to load into your PowerBI data model, this whole process should be automated and ideally done within PowerBI.
Fortunately, this turns out to be quite simple! Power Query provides a native function to convert any binary to a Base64 encoded string: Binary.ToText() . The important part to point out here is to use the second parameter which allows you to set the encoding of the resulting text. It supports two values: BinaryEncoding.Base64 (default) and BinaryEncoding.Hex. Once we have the Base64 string, we simply need to prefix it with the following meta data: “data:image/jpeg;base64, “
To make it easy, I wrote to two custom PowerQuery functions which convert and URL or a binary image to the appropriate string which can be used by PowerBI:
let
    UrlToImage = (ImageUrl as text) as text =>
let
    BinaryContent = Web.Contents(ImageUrl),
    Base64 = "data:image/jpeg;base64, " & Binary.ToText(BinaryContent, BinaryEncoding.Base64)
in
    Base64
in
    UrlToImage
let
    BinaryToPbiImage = (BinaryContent as binary) as text=>
let
    Base64 = "data:image/jpeg;base64, " & Binary.ToText(BinaryContent, BinaryEncoding.Base64)
in
    Base64
in
    BinaryToPbiImage
If your images reside in a local folder, you can simply load them using the “Folder” data source. This will give you a list of all images and and their binary content as separate column. Next add a new Custom Column where you call the above function to convert the binary to a prefixed Base64 string which can then be displayed in PowerBI (or Analysis Services) as a regular image. Just make sure to also set the Data Category of the column to “Image URL”:
And that’s it, now your visual will display the image stored in the data model without having to access any external resources!
Caution: As Jason also mentions at the end of his blog post, there is an internal limitation about the size of a text column. So this may cause issues when you try to load high-resolution images! In this case, simply lower the size/quality of the images before you load them. UPDATE May 2019: Chris Webb provides much more information and a solution(!) to this issue in his blog post: https://blog.crossjoin.co.uk/2019/05/19/storing-large-images-in-power-bi-datasets
Download:StoreImageInPbiModel.pbix This PowerBI Desktop model contains all samples from above including the PowerQuery functions!
One of the most requested features when it comes to Azure ML is and has always been the integration into PowerBI. By now we are still lacking a native connector in PowerBI which would allow us to query a published Azure ML web service directly and score our datasets. Reason enough for me to dig into this issue and create some Power Query M scripts to do this. But lets first start off with the basics of Azure ML Web Services.
Every Azure ML project can be published as a Web Service with just a single click. Once its published, it can be used like any other Web Service. Usually we would send a record or a whole dataset to the Web Service, the Azure ML models does some scoring (or any other operation within Azure ML) and then sends the scored result back to the client. This is straight forward and Microsoft even supplies samples for the most common programming languages. The Web Service relies on a standardized REST API which can basically be called by any client. Yes, in our case this client will be PowerBI using Power Query. Rui Quintino has already written an article on AzureML Web Service Scoring with Excel and Power Query and also Chris Webb wrote a more generic one on POST Request in Power Query in general Web Service and POST requests in Power Query. Even Microsoft recently published an article how you can use the R Integration of Power Query to call a Azure ML Web Service here.
Having tried these solutions, I have to admit that they have some major issues: 1) very static / hard coded 2) complex to write 3) operate on row-by-row basis and might run into the API Call Limits as discussed here. 4) need a local R installation
As Azure ML usually deal with tables, which are basically Power Query DataSets, a requirement would be to directly use a Power Query DataSet. The DataSet has to be converted dynamically into the required JSON structure to be POSTed to Azure ML. The returned result, usually a table again, should be converted back to a Power Query DataSet. And that’s what I did, I wrote a function that does all this for you. All information that you have to supply can be found in the configuration of your Azure ML Web Service: – Request URI of your Web Service – API Key – the [Table to Score]
the [Table to Score] can be any Power Query table but of course has to have the very same structure (including column names and data types) as expected by the Web Service Input. Then you can simply call my function:
The whole process involves a lot of JSON conversions and is kind of complex but as I encapsulated everything into M functions it should be quite easy to use by simply calling the CallAzureMLService-function.
However, here is a little description of the used functions and the actual code:
ToAzureMLJson – converts any object that is passed in as an argument to a JSON element. If you pass in a table, it is converted to a JSON-array. Dates and Numbers are formatted correctly, etc. so the result can the be passed directly to Azure ML.
let
    ToAzureMLJson= (input as any) as text =>
let
    transformationList = {
        [Type = type time, Transformation = (value_in as time) as text => """" & Time.ToText(value_in, "hh:mm:ss.sss") & """"],
        [Type = type date, Transformation = (value_in as date) as text => """" & Date.ToText(value_in, "yyyy-MM-dd") & """"],
        [Type = type datetime, Transformation = (value_in as datetime) as text => """" & DateTime.ToText(value_in, "yyyy-MM-ddThh:mm:ss.sss" & """")],
        [Type = type datetimezone, Transformation = (value_in as datetimezone) as text => """" & DateTimeZone.ToText(value_in, "yyyy-MM-ddThh:mm:ss.sss") & """"],
        [Type = type duration, Transformation = (value_in as duration) as text => ToAzureMLJson(Duration.TotalSeconds(value_in))],

        [Type = type number, Transformation = (value_in as number) as text => Number.ToText(value_in, "G", "en-US")],
        [Type = type logical, Transformation = (value_in as logical) as text => Logical.ToText(value_in)],

        [Type = type text, Transformation = (value_in as text) as text => """" & value_in & """"],

        [Type = type record, Transformation = (value_in as record) as text =>
                            let
                                GetFields = Record.FieldNames(value_in),
                                FieldsAsTable = Table.FromList(GetFields, Splitter.SplitByNothing(), {"FieldName"}, null, ExtraValues.Error),
                                AddFieldValue = Table.AddColumn(FieldsAsTable, "FieldValue", each Record.Field(value_in, [FieldName])),
                                AddJson = Table.AddColumn(AddFieldValue, "__JSON", each ToAzureMLJson([FieldValue])),

                                jsonOutput = "[" & Text.Combine(AddJson[__JSON], ",") & "]"
                            in
                                jsonOutput
                            ],
        [Type = type table, Transformation = (value_in as table) as text =>
                            let
                                BufferedInput = Table.Buffer(value_in),
                                GetColumnNames = Table.ColumnNames(BufferedInput),
                                ColumnNamesAsTable = Table.FromList(GetColumnNames , Splitter.SplitByNothing(), {"FieldName"}, null, ExtraValues.Error),
                                ColumnNamesJson = """ColumnNames"": [""" & Text.Combine(ColumnNamesAsTable[FieldName], """, """) & """]",

                                AddJson = Table.AddColumn(value_in, "__JSON", each ToAzureMLJson(_)),
                                ValuesJson = """Values"": [" & Text.Combine(AddJson[__JSON], ",#(lf)") & "]",

                                jsonOutput = "{""Inputs"": { ""input1"": {" & ColumnNamesJson & "," & ValuesJson & "} }, ""GlobalParameters"": {} }"
                            in
                                jsonOutput
                            ],
        [Type = type list, Transformation = (value_in as list) as text => ToAzureMLJson(Table.FromList(value_in, Splitter.SplitByNothing(), {"ListValue"}, null, ExtraValues.Error))],

        [Type = type binary, Transformation = (value_in as binary) as text => """0x" & Binary.ToText(value_in, 1) & """"],


        [Type = type any, Transformation = (value_in as any) as text => if value_in = null then "null" else """" & value_in & """"]

    },

    transformation = List.First(List.Select(transformationList , each Value.Is(input, _[Type]) or _[Type] = type any))[Transformation],

    result = transformation(input)
in
    result
in
    ToAzureMLJson
AzureMLJsonToTable – converts the returned JSON back to a Power Query Table. It obeys column names and also data types as defined in the Azure ML Web Service output. If the output changes (e.g. new columns are added) this will be taken care of dynamically!
let
    AzureMLJsonToTable = (azureMLResponse as binary) as any =>
let
    WebResponseJson = Json.Document(azureMLResponse ,1252),
    Results = WebResponseJson[Results],
    output1 = Results[output1],
    value = output1[value],
    BufferedValues = Table.Buffer(Table.FromRows(value[Values])),
    ColumnNameTable = Table.AddIndexColumn(Table.FromList(value[ColumnNames], Splitter.SplitByNothing(), {"NewColumnName"}, null, ExtraValues.Error), "Index", 0, 1),
    ColumnNameTable_Values = Table.AddIndexColumn(Table.FromList(Table.ColumnNames(BufferedValues), null, {"ColumnName"}), "Index", 0, 1),

    RenameList = Table.ToRows(Table.RemoveColumns(Table.Join(ColumnNameTable_Values, "Index", ColumnNameTable, "Index"),{"Index"})),
    RenamedValues = Table.RenameColumns(BufferedValues, RenameList),

    ColumnTypeTextTable = Table.AddIndexColumn(Table.FromList(value[ColumnTypes], Splitter.SplitByNothing(), {"NewColumnType_Text"}, null, ExtraValues.Error), "Index", 0, 1),
    ColumnTypeText2Table = Table.AddColumn(ColumnTypeTextTable, "NewColumnType", each
     if Text.Contains([NewColumnType_Text], "Int") then type number
else if Text.Contains([NewColumnType_Text], "DateTime") then type datetime
else if [NewColumnType_Text] = "String" then type text
else if [NewColumnType_Text] = "Boolean" then type logical
else if [NewColumnType_Text] = "Double" or [NewColumnType_Text] = "Single" then type number
else if [NewColumnType_Text] = "datetime" then type datetime
else if [NewColumnType_Text] = "DateTimeOffset" then type datetimezone
else type any),
    ColumnTypeTable  = Table.RemoveColumns(ColumnTypeText2Table ,{"NewColumnType_Text"}),

    DatatypeList = Table.ToRows(Table.RemoveColumns(Table.Join(ColumnNameTable, "Index", ColumnTypeTable, "Index"),{"Index"})),
    RetypedValues = Table.TransformColumnTypes(RenamedValues, DatatypeList, "en-US"),

    output = RetypedValues
in
    output
in
    AzureMLJsonToTable
CallAzureMLService – uses the two function from above to convert a table to JSON, POST the JSON to Azure ML and convert the result back to a Power Query Table.
let
    CallAzureMLService = (
        WebServiceURI as text,
        WebServiceKey as text,
        TableToScore as table,
        optional Timeout as number
    ) as any =>
let
    WebTimeout = if Timeout = null then #duration(0,0,0,100) else #duration(0,0,0,Timeout) ,

    WebServiceContent = ToAzureMLJson(TableToScore),

    WebResponse = Web.Contents(WebServiceURI,
        [Content = Text.ToBinary(WebServiceContent),
         Headers = [Authorization="Bearer " & WebServiceKey,
                    #"Content-Type"="application/json",
                    Accept="application/json"],
         Timeout = WebTimeout]),

    output = AzureMLJsonToTable(WebResponse)
in
    output
in
    CallAzureMLService
Known Issues: As the [Table to Score] will probably come from a SQL DB or somewhere else, you may run into issues with Privacy Levels/Settings and the Formula Firewall. In this case make sure to enable Fast Combine for your workbook as described here.
The maximum timeout of a Request/Response call to an Azure ML Web Service is 100 seconds. If your call exceeds this limit, you might get an error message returned.I ran a test and tried to score 60k rows (with 2 numeric columns) at once and it worked just fine, but I would assume that you can run into some Azure ML limits here very easily with bigger data sets. As far as I know, these 100 seconds are for the Azure ML itself only. If it takes several minutes to upload your dataset in the POST request, than this is not part of this 100 seconds. If you are still hitting this issue, you could further try to split your table into different batches, score them separately and combine the results again afterwards.
So these are the steps that you need to do in order to use your Azure ML Web Service together with PowerBI: 1) Create an Azure ML Experiment (or use an existing) 2) Publish the Experiment as a Web Service 3) note the URL and the API Key of your Web Service 4) run PowerBI and load the data that you want to score 5) make sure that the dataset created in 4) has the exact same structure as expected by Azure ML (column names, data types, …) 6) call the function “CallAzureMLWebService” with the parameters from 3) and 5) 7) wait for the Web Service to return the result set 8) load the final table into PowerBI (or do some further transformations before)
And that’s it!
Download: You can find a PowerBI workbook which contains all the functions and code here: CallAzureMLWebService.pbix I used a simple Web Service which takes 2 numeric columns (“Number1” and “Number2”) and returns the [Number1] * [Number2] and [Number1] / [Number2]
PS: you will not be able to run the sample as it is as I changed the API Key and also the URL of my original Azure ML Web Service
One of the coolest features of Power BI is that I integrates very well with other tools and also offers a lot of interfaces which can be used to extend this capabilities even further. One of those is the R Integration which allows you to run R code from within Power BI. R scripts can either be used as a data source or for visualizing your data. In this post I will focus on the data source component and show how you can use a locally stored R script and execute it directly in Power BI. Compared to the native approach where you need to embed the R code in the Power BI file, this has several advantages:
Develop R script in familiar external tool like RStudio
Integration with Source Control
Leverage Power BI for publishing and visualizing results
Out of the box Power BI only supplies one function to call R scripts as a data source which is R.Execute(text). Usually, when you use the wizard, it simply passes your R script as a hardcoded value to this function. Knowing the power of Power BI and its scripting language M for data integration made me think – “Hey, as R scripts are just text files and Power BI can read text files, I could also dynamically read any R script and execute it!”
Well, turns out to be true! So I created a little M function where I pass in the file-path of an existing R script and which returns a table of data frames which are created during the execution of the script. Those can then be used like any other data sets/tables within Power BI:
And here is the corresponding M code for the Power Query function: (Thanks also to Imke Feldmann for simplifying my original code to the readable one below)
let
LoadLocalRScript = (file_path as text) as table =>
First we read the R script like any other regular CSV file but we use line-feed (“#(lf)”) as delimiter. So we get a table with one column and one row for each line of our original R script. Then we use Text.Combine() on our column to transform the single lines back into one long text resembling our original R script. This text can the be passed to the R.Execute() function to return the list of R data frames created during the execution of the script.
And that’s it! Any further steps are similar to using any regular R script which is embedded in Power BI so it is up to you on how you proceed from here. Just one thing you need to keep in mind is that changing the local R script might break the Power BI load if you changed or deleted any data frames which are referenced in Power BI later on.
One issues that I came across during my tests is that this approach does not work with scheduled refreshes in the Power BI Web Service via the Personal Gateway. The first reason for this is that it is currently not possible to use scheduled refresh if custom functions are involved. Even if you can work around this issue pretty easily by using the code from above directly in Power Query I still ran into issues with different privacy levels for the location of the R script and the R.Execute() function. But I will investigate into those issues and update this blog post accordingly (see UPDATE below). For the future I hope that is fixed by Microsoft and Power BI allows you to execute remote scripts natively – but until then, this approach worked quite well for me.
UPDATE: To make the refresh via the Personal Gateway work you have to enable “FastCombine”. How to do this is described in more detail here: Turn on FastCombine for Personal Gateway.
In case you are interested in more details on this approach, I am speaking at TugaIT in Lisbon, Portugal this Friday (20th of May 2016) about “Power BI for the Data Scientist” where I will cover this and lots of other interesting topics about the daily work of a data scientist and how PowerBI can used to ease them.
UPDATE: This does not work for Tabular Models in Compatibility Level 120 or above as they do not expose the calculation dependencies anymore!
One of my best practices when designing bigger SQL Server Analysis Services (SSAS) Tabular models is to nest calculations whenever possible. The reasons for this should be quite obvious:
no duplication of logics
easier to develop and maintain
(caching)
However, this also comes with a slight drawback: after having created multiple layers of nested calculations it can be quite hart to tell on which measures a top-level calculations actually depends on. Fortunately the SSAS engine exposes this calculation dependencies in one of its DMVs – DISCOVER_CALC_DEPENDENCY. This DMV basically contains information about all calculations in the model:
Calculated Measures
Calculated Columns
Relationships
Dependencies to Tables/Columns
Chris Webb already blogged about this DMV some time ago and showed some basic (tabular) visualization within an Excel Pivot table (here). My post focuses on PowerBI and how can make the content of this DMV much more appealing and visualize it in a way that is very easy to understand. As the DMV is built up like a parent-child hierarchy, I had to use a recursive M-function to resolve this self-referencing table which actually was the hardest part to do. Each row contains a link to a dependent object, which can have other dependencies again. In order to visualize this properly and let the user select a Calculation of his choice to see a calculation tree, I needed to expand each row with all of its dependencies, keeping their link to the root-node:
Here is a little example:
Object
Referenced_Object
A
B
B
C
The table above is resolved to this table:
Root
Object
Referenced_Object
A
A
B
A
B
C
B
B
C
The Root-column is then used to filter and get all dependent calculations. The PowerBI file also contains some other M-functions but those are mainly for ease-of-use and to keep the queries simple.
You can use the Slicers to filter on the Table, the Calculation Type and the Calculation itself and the visual shows all the dependencies down to the physical objects being Tables and Columns. This makes it a lot easier to understand your model and the dependencies that you built up over time. I attached the sample-PowerBI-file below. You simply need to change the connectionstring to your SSAS Tabular Server and refresh the data connections.
Data is the daily bread-and-butter for any analyst. In order to provide good results you also need good data. Sometimes this data is very well prepared beforehand and you can use it as it is but it is also very common that you need to prepare and transform the data on your own. To do this Microsoft has introduced Power Query (on tool of the Power BI suite). Power Query can be used to extract, transform and load data into Excel and/or Power Pivot directly.
When using any data you usually know what the data looks like and what to expect from certain columns – e.g. a value is delivered as a number, a text contains exactly 4 characters, etc.
Though, sometimes this does not apply for all rows of that dataset and your transformation logics may cause errors because of that. In order to avoid this and still have a clean data load you need to handle those errors. Power Query offers several options to this which I will elaborate in this post.
This is the sample data I will use for the following samples:
A
B
C
1
4
AXI23
2
5
TZ560
NA
6
UP945
we will perform simple transformations and type casts on this table to generate some errors:
Error-handling on row-level
This is the easiest way of handling errors. Whenever a transformation causes an error, we can simply remove the whole row from the result set:
This will generate the following result table:
A
B
C
1
4
AX312
2
5
TZ560
As you can see, the third row was simply removed. This is the easiest way on how to remove errors from your result set but of course this may not be what you want as those removed rows may contain other important information in other columns! Assume you want to calculate the SUM over all values in column B. As we removed the third row we also removed a value from column B and the SUM is not the same as without the error-handling (9 vs. 15)!
Error-handling on cell-level
As we now know that column A may result in an error, we can handle this error during our transformation steps. As “NA” could not be converted to a number we see Error as result for that column. Clicking on it gives use some more details on the error itself. To handle this error we need to create a new calculated column where we first check if the value can be converted to a number and otherwise return a default numeric value:
The M-function that we use is “try <expressions to try> otherwise <default if error>” which is very similar to a try-catch block in C#. If the expression causes an error, the default will be used instead. Details on the try-expression can be found in the Microsoft Power Query for Excel Formula Language Specification (PDF) which can be found here and is a must read for everyone interested in the M language.
We could further replace our column A by the new column A_cleaned to hide this error handling transformation.
A
B
C
A_cleaned
1
4
AXI23
1
2
5
TZ560
2
NA
6
UP945
0
Error-handling on cell-level with error details
There may also be cases where it is OK to have one of this errors but you need/want to display the cause of the error so that a power user may correct the source data beforehand. Again we can use the try-function, but this time without the otherwise-clause. This will return a record-object for each row:
After expanding the A_Try column and also the A_Try.Error column we will get all available information on the error:
A
B
C
A_Try.HasError
A_Try.Value
A_Try.Error.Reason
A_Try.Error.Message
A_Try.Error.Detail
1
4
AXI23
FALSE
1
2
5
TZ560
FALSE
2
6
UP945
TRUE
DataFormat.Error
Could not convert to Number.
NA
As you can see we get quite a lot of columns here. We could e.g. use A_Try.HasError to filter out error rows (similar to error-handling on row-level) or we could use it in a calculated column to mimic error-handling on cell-level. What you want to do with all the information is up to you, but in case you don’t need it you should remove all unnecessary columns.