If you have ever tried to implement a recursive calculations in DAX similar to how you would have done it back in the good old days of MDX (see here) you would probably have come up with a DAX formula similar to the one below:
- Sales ForeCast :=
- IF (
- NOT ( ISBLANK ( [Sales] ) ),
- [Sales],
- CALCULATE (
- [Sales ForeCast],
- DATEADD ( 'Date'[Calendar], –1, MONTH )
- ) * 1.05
- )
However, in DAX you would end up with the following error:
| A circular dependency was detected: ‘Sales'[Sales ForeCast],’Sales'[Sales ForeCast]. |
This makes sense as you cannot reference a variable within its own definition – e.g. X = X + 1 cannot be defined from a mathematical point of view (at least according to my limited math skills). MDX is somehow special here where the SSAS engine takes care of this recursion by taking the IF() into account.
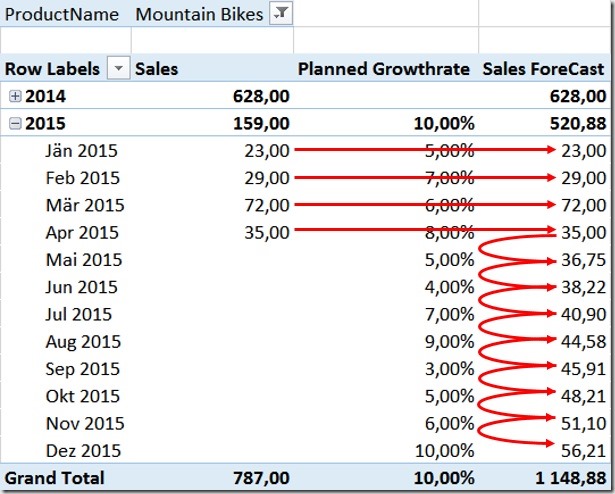
So where could you possible need a recursive calculation like this? In my example I will do some very basic forecasting based on monthly growth rates. I have a table with my actual sales and another table for my expected monthly growth as percentages. If I do not have any actual sales I want to use my expected monthly growth to calculate my forecast starting with my last actual sales:
This is a very common requirement for finance applications, its is very easy to achieve in pure Excel but very though to do in DAX as you probably realized on your own what finally led you here ![]()
In Excel we would simply add a calculation like this and propagate it down to all rows:![]()
(assuming column C contains your Sales, D your Planned Growth Rate and M is the column where the formula itself resides)
In order to solve this in DAX we have to completely rewrite our calculation! The general approach that we are going to use was already explained by Mosha Pasumansky some years back, but for MDX. So I adopted the logic and changed it accordingly to also work with DAX. I split down the solution into several steps:
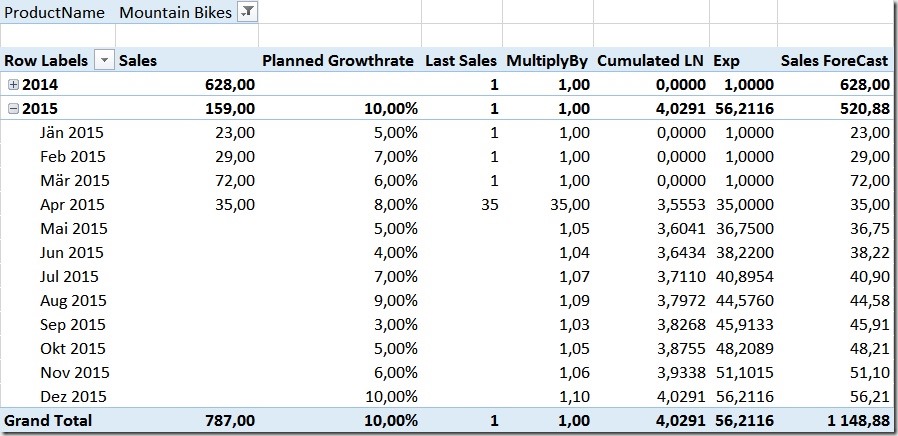
1) find the last actual sales – April 2015 with a value of 35
2) find out with which value we have to multiply our previous months value to get the current month’s Forecast
3) calculate the natural logarithm (DAX LN()-function) of the value in step 2)
4) Sum all values from the beginning of time until the current month
5) Raise our sum-value from step 4) to the power of [e] using DAX EXP()-function
6) do some cosmetic and display our new value if no actual sales exist and take care of aggregation into higher levels
Note: The new Office 2016 Preview introduces a couple of new DAX functions, including PRODUCTX() which can be used to combine the Steps 3) to 5) into one simple formula without using any complex LN() and EXP() combinations.
Step 1:
We can use this formula to get our last sales:
- Last Sales :=
- IF (
- ISBLANK (
- CALCULATE (
- [Sales],
- DATEADD ( 'Date'[DateValue], 1, MONTH )
- )
- ),
- [Sales],
- 1
- )
It basically checks if there are no [Sales] next month. If yes, we use the current [Sales]-value as our [Last Sales], otherwise we use a fixed value of 1 as a multiplication with 1 has no impact on the final result.
Step 2:
Get our multiplier for each month:
- MultiplyBy :=
- IF (
- ISBLANK ( [Last Sales] ),
- 1 + [Planned GrowthRate],
- [Last Sales]
- )
If we do not have any [Last Sales], we use our [Planned GrowthRate] to for our later multiplication/summation, otherwise take our [Last Sales]-value.
Step 3 and 4:
As we cannot use “Multiply” as our aggregation we first need to calculate the LN and sum it up from the first month to the current month:
- Cumulated LN :=
- CALCULATE (
- SUMX ( VALUES ( 'Date'[Month] ), LN ( [MultiplyBy] ) ),
- DATESBETWEEN (
- 'Date'[DateValue],
- BLANK (),
- MAX ( 'Date'[DateValue] )
- )
- )
Step 5 and 6:
If there are no actual sales, we display our calculated Forecast:
- Sales ForeCast :=
- SUMX (
- VALUES ( 'Date'[Month] ),
- IF ( ISBLANK ( [Sales] ), EXP ( [Cumulated LN] ), [Sales] )
- )
Note that we need to use SUMX over our Months here in order to also get correct subtotals on higher levels, e.g. Years. That’s all the SUMX is necessary for, the IF itself should be self-explaining here.
So here is the final result – check out the last column:
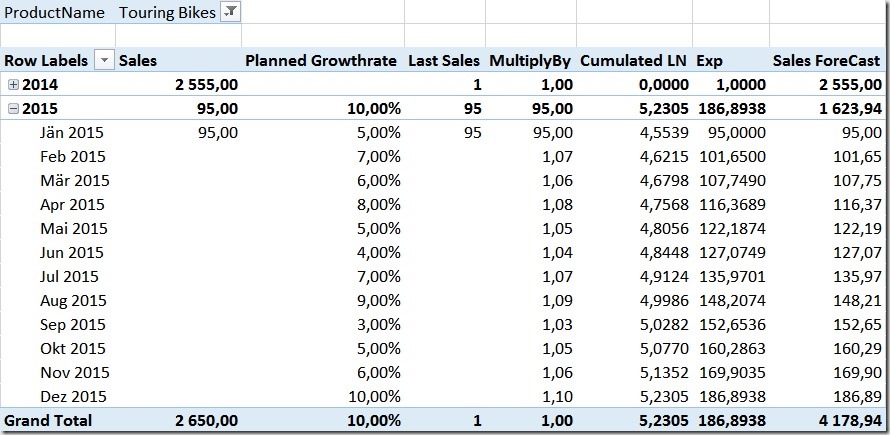
The calculation is flexible enough to handle missing sales. So if for example we would only have sales for January, our recursion would start there and use the [Planned GrowthRate] already to calculate the February Forecast-value:
Quite handy, isn’t it?
The sample-workbook (Excel 365) can be downloaded here: RecursiveCalculations.xlsx
