In my previous post I wrote about how to use PowerPivot on top of a relational database that is modeled as a star-schema with slowly changing dimension type 2 (SCD2) historization. In this post I will advance this approach by adding other tables tables that are not related to our facts but have a relationship to our current dimension tables based on an other attribute.
I will take the example from my previous post and extend it by a new table called "WarehouseOwner". This table looks as follows:
WarehouseOwner
| Warehouse Owner_SID |
Warehouse Owner_BK |
Manager | VALID_FROM | VALID_TO |
| 1 | John | Peter | 2012-01-01 | 2012-01-03 |
| 2 | Dave | Peter | 2012-01-01 | |
| 3 | John | Dan | 2012-01-03 |
This table holds information about the warehouse owner and its manager. In this example the manager of John changed from Peter to Dan with the 3rd of January. Remember that we have a WarehouseOwner-Column also in our Warehouse-table.
Logically this new table can be related to our Warehouse-table but as PowerPivot only supports 1:n relationships this is natively not supported and we have to use DAX to simulate this relationship. Most of the steps are similar to the steps that we have already done for our other SCD2-tables. First of all we create a ‘IsValid’-measure to identify rows that are valid for the selected referencedate:
WarehouseOwner_IsValid:=COUNTROWS(
FILTER(
     WarehouseOwner;
     (WarehouseOwner[VALID_FROM] <= 'Date'[ReferenceDate]
        || ISBLANK(WarehouseOwner[VALID_FROM]))
     && (WarehouseOwner[VALID_TO] > 'Date'[ReferenceDate]
        || ISBLANK(WarehouseOwner[VALID_TO]))))>0
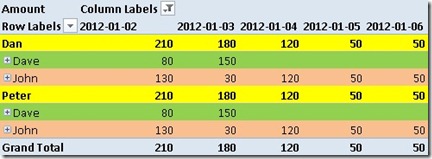
The next step would be to mimic a relationship between our Inventory-table and our WarehouseOwner-table. But opposed to our old star-schema where each table was directly related to the Inventory-table, this is not possible with our new snowflake-schema anymore. So we have to relate our WarehouseOwner-table with our facts using the Warehouse-table. Without any relationship the result would look as follows:
This result is similar to a crossjoin of our Managers and our Warehouse-Owners regardless of time and validity. But we need to analyze which Manager was responsible for which warehouse owners and respectively their warehouse at any given point in time. To relate our tables we have to identify the combinations that are valid for the selected referencedate. If you reconsider these requirements, you will realize that this is similar to the relationships that we had to define to link our other tables to the inventory-table. Again we can use CONTAINTS()-function in combination with FILTER() and a IsValid-Measure but in this case we use them in our Warehouse-table to extend our Warehouse_IsValid-Measure:
Warehouse_IsValid_New:=COUNTROWS(
FILTER(
     Warehouse;
     (Warehouse[VALID_FROM] <= 'Date'[ReferenceDate]
		|| ISBLANK(Warehouse[VALID_FROM]))
     && (Warehouse[VALID_TO] > 'Date'[ReferenceDate]
		|| ISBLANK(Warehouse[VALID_TO]))
     && CONTAINS(
		FILTER(
			VALUES(WarehouseOwner[WarehouseOwner_BK]);
			WarehouseOwner[WarehouseOwner_IsValid]);
		WarehouseOwner[WarehouseOwner_BK];
		Warehouse[WarehouseOwner_BK])))>0
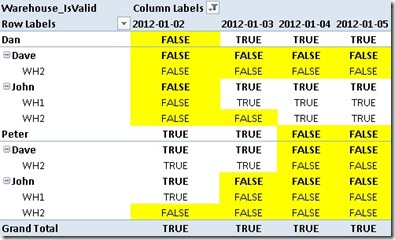
Using our new Warehouse_IsValid-measure in a PivotTable reveals which combinations are valid for a given time:
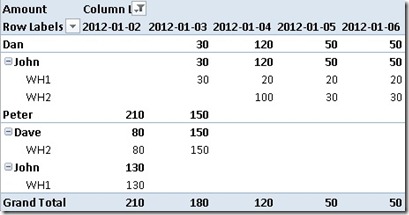
Actually this is already all we have to do here to get the desired result, we do not have to touch any other formula in our model! By replacing our Warehouse_IsValid-Measure with our previous Amount-Measure we can see the final result:
When Dan becomes the Manager of John with the 3rd of January also the facts that are related to warehouses belonging to John are associated with Dan. As with the 4th of January John also becomes the owner of WH2 (now owning both/all warehouses) Dave and also its manager Peter do not have any facts related to them anymore.
As you can see this approach can be very easily extended by new tables even if the they are modeled in a snowflake-schema. All you have to do is to modify the IsValid-Measure of the main-table that relates to the new table.
Stay tuned for the next post where I will analyze the performance of this solution with large amounts of data!
Download Final Model


![PT_Warehouse_IsValid_thumb[2] PT_Warehouse_IsValid_thumb[2]](https://blog.gbrueckl.at/wp-content/uploads/2012/02/pt_warehouse_isvalid_thumb2_thumb.jpg)
![PT_Amount_by_Warehouse_thumb[1] PT_Amount_by_Warehouse_thumb[1]](https://blog.gbrueckl.at/wp-content/uploads/2012/02/pt_amount_by_warehouse_thumb1_thumb.jpg)
![PT_Amount_by_Warehouse_SingleDate_thumb[2] PT_Amount_by_Warehouse_SingleDate_thumb[2]](https://blog.gbrueckl.at/wp-content/uploads/2012/02/pt_amount_by_warehouse_singledate_thumb2_thumb.jpg)