A very common requirement for a Power BI report that I stumble across at almost all of my customers is to automatically show data for the current day/month/year when a report is opened. At first sight this seems like a very trivial problem but once you dig into the problem, you will realize that all of the common solutions out there have some disadvantages and only solve the problem partially.
So here is what we want to achieve:
- Show the Current Month (or Day, or Year) by default
- Works [in combination] with all other columns in the date table.
- A single, easy to use slicer/filter to control the time selection and change from Current Month/Day/Year to any other value
- Works with built-in time intelligence functions
- Works with existing DAX measures
- Works with any datamodel/report
Solutions like Relative Time Filter/Slicer, DAX or relative flags in the date table address only some points of the above list but definitely not all of them which is why I thought we need a better solution to this:
(please use full-screen mode)
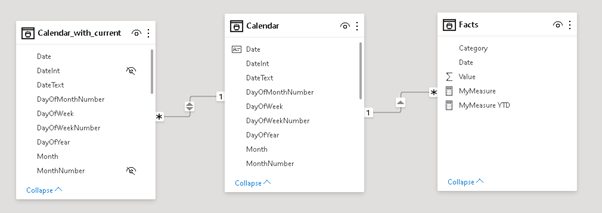
We actually created a new table in our data model that is linked to the original date table. The reason why we cannot use the same table here is that the new table does not have unique date values as all dates/rows referring to our current calculations are duplicated. It has to be a many-to-one relationship with cross-filter direction set to both (even though we will only use the new table ‘Calendar_with_current’ to filter the existing table ‘Calendar’):

And that’s it basically. You can now exchange the original Calendar table with the new one to get the new “Current” values in your report. If you have time intelligence functions in place, you further need to extend them and add ALL('Calendar_with_current ') as a filter to make them work also with the new table. The old table can also be hidden now if you do not want to confuse the end users. To make a seamless switch you can further rename the tables.
I added an additional column to the table called Type that allows you to select which values you want to show – the original values (e.g. “September”), the values with “Current X” (e.g. “Current Month”), or both.Please see the second page/tab of the embedded report above.
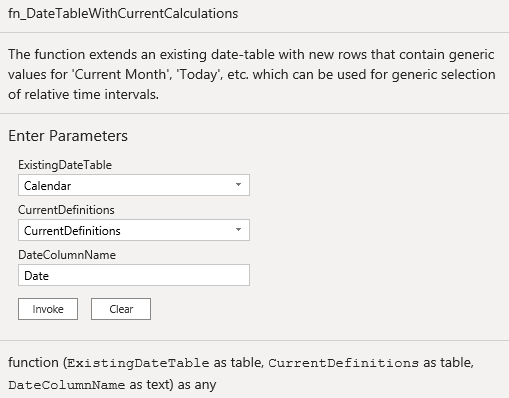
So this raises the question how this new table can be created? To simplify this I have created a Power Query function that takes 3 parameters:
- The current date table
- A list of definitions of your current-values
- The name of the unique date-column in your current date table (parameter 1)

The first and the third parameter should be clear, but what are the “CurrentDefinitions”?
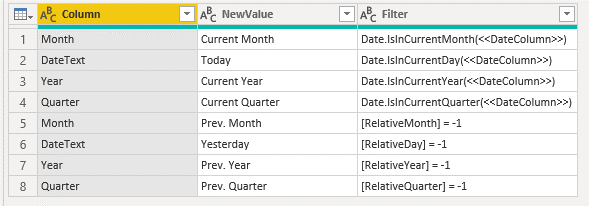
It is basically a table which defines the relative time calculations that you want to extend your existing date table with. Here is an example:

The column Column refers to the column in which you want to create the relative date definition. The column NewValue specifies the value that you want to set for rows that match the third column Filter. The column Filter either takes a static filter expression like [RelativeMonth] = 1 (as in lines 5-8) but can also use existing M-functions and reference the existing Date-column using the placeholder <<DateColumn>> as you can see in lines 1-4.
The table can be maintained using “Enter Data” and can contain any number of rows/definitions!
For most of my scenarios this works pretty well and addresses all major problems highlighted above.
The latest Power Query function can be downloaded from my github repository: fn_DateTableWithCurrentCalculations.pq
Power BI desktop files can be downloaded from here: PBIX PBIT