Deploying an Azure Data Factory project as ARM Template

In my last post I wrote about how to Debug Custom .Net Activities in Azure Data Factory locally. This fixes one of the biggest issues in Azure Data Factory at the moment for developers. The next bigger problem that you will run into is when it comes to deploying your Azure Data Factory project. At the moment, you can only do it manually from Visual Studio which, for bigger projects, can take quite some time. So I extended and advanced the code from my CustomActivityDebugger. Well, actually I rewrote some major parts of it and moved it into a new GitHub repository: Azure.DataFactory.LocalEnvironment

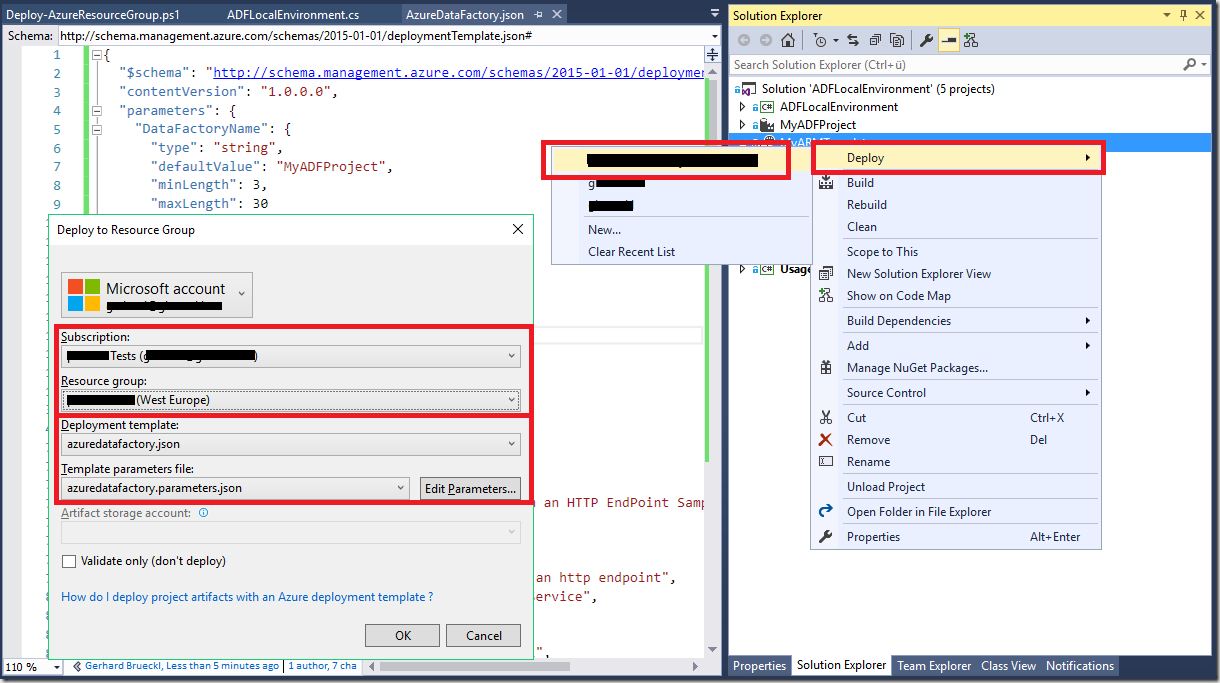
The new code base now includes the functionality to export an existing ADF project to an ARM template which can then be deployed very easily using Azure standard deployment mechanisms.

So basically, these are the changes and new Features that I made:

Export as ARM template:

  • Export all ADF objects and properties
  • Support for configurations
  • obey dependencies between ADF objects
  • parameterized Data Factory name
  • automatic upload of ADF dependencies (e.g. custom activities)
  • specify the region where ADF should be deployed (ADF is not available in all regions yet!)

ADF_LocalEnvironment_DeployARMTemplate

Custom Activity Debugger:

  • simplified usability – just select the pipeline, activity and set the slice-dates
  • Support for configurations
  • no need to add any namespaces
  • no need to add any references
  • write activity log to console output

ADF_LocalEnvironment_DebugActivity_Breakpoing

General:

  • Load from the ADF Project file (.dfproj) instead of a whole folder
  • implemented as Assembly
  • can be used in a Console Application for automation
  • will be published via NuGet in the future! (coming soon)


Everything else is described in the Git-Repository itself!

Hope you enjoy it!
Debugging Custom .Net Activities in Azure Data Factory


UPDATE 2017-02-22:
I released a new toolset for Azure Data Factor which also integrates the Customer .Net Activity Debugger from this blob post. Please refer to the new GitHub project: https://github.com/gbrueckl/Azure.DataFactory.LocalEnvironment

(all links have been changed to refer to the new repository!)


Azure Data Factory (ADF) is one of the newer tools of the whole Microsoft Data Platform on Azure. It is Microsoft’s Data Integration tool, which allows you to easily load data from you on-premises servers to the cloud (and also the other way round). It comes with some handy templates to copy data fro various sources to any available destination. However, when the Extract-Transform-Load (ETL) or ELT steps get more complicated you will hit the (current) out-of-the-box limits of Azure Data Factory pretty soon. But this is OK as ADF is a very open platform and allows you to integrate so called “Custom Activities”. These can either be .Net/C# Activities or HDInsight Activities. In this post we will focus on .Net Activities and how to develop and debug them in an efficient way.

A .Net Activity is basically just a .dll which implements a specific Interface (IDotNetActivity)and is then executed by the Azure Data Factory. To be more precise here, the .dll (and all dependencies) are copied to an Azure Batch Node which then executes the code when the .Net Activity is scheduled by ADF. So far so good, but the tricky part is to actually develop the .Net code, test, and debug it. Well, not the code itself but the more or less complex integration with the ADF Interface which you are very likely not familiar with in the beginning. In such cases it usually helps to run the code locally, step into the different code paths and examine the C# objects and their values. The problem is that you do not have a local instance of ADF on your workstation which you could use the start the .Net Activity and debug it interactively in Visual Studio.
So I wrote my own tool which you can add to the Solution that already contains the code of your Custom .Net Activity. Then you can simply link the CustomActivityDebugger to the JSON definitions and configurations of your ADF project, reference your custom code, configure some other things like SliceStart/SliceEnd and you are ready to go.
Once you start the CustomActivityDebugger it will read all ADF files and settings and basically create a local ADF environment which helps you to debug your custom .Net Activity using all settings and parameters as they would be passed in when the code is executed on the Azure Batch Node.

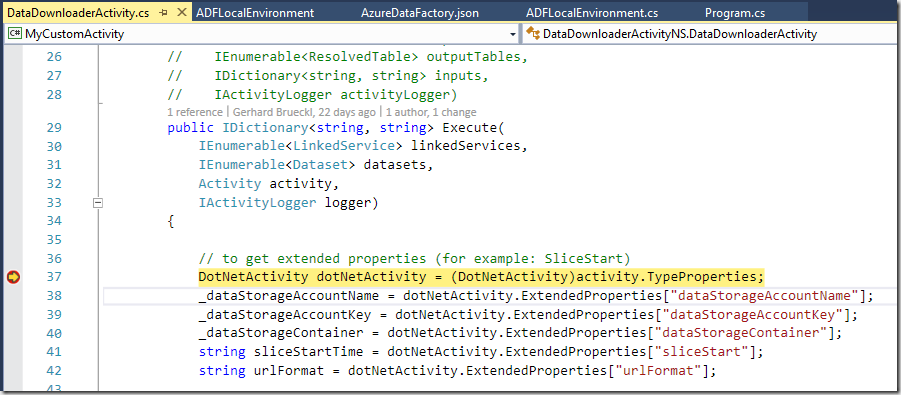
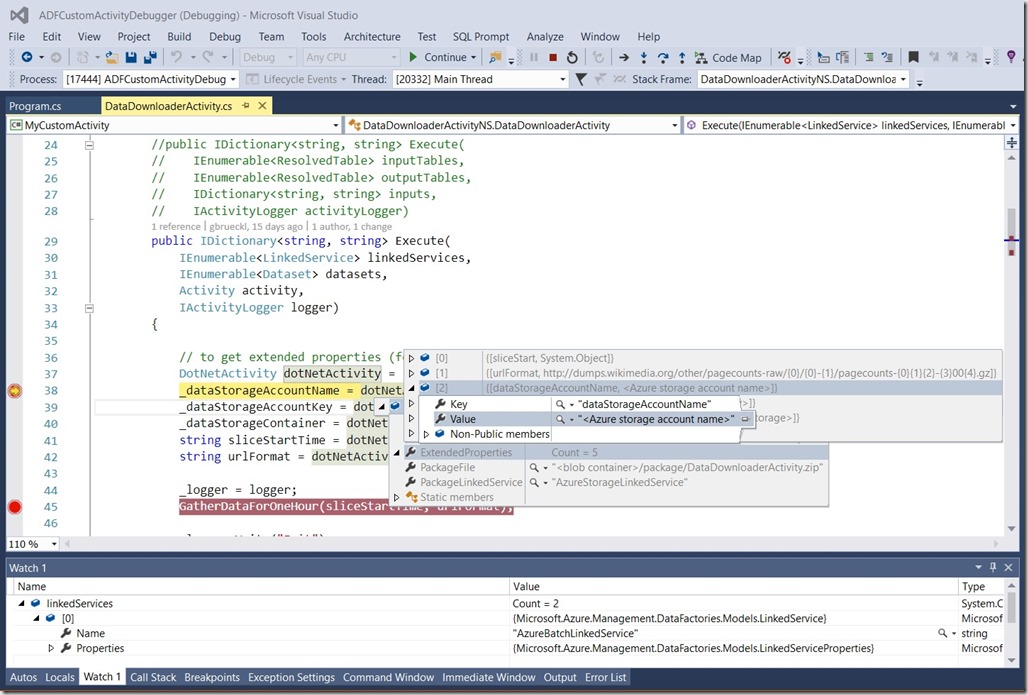
This little picture shows the CustomActivityDebugger in action – debugging custom .Net activities is now like debugging any other code:
Debugger_in_Action

All the sources including a simple ADF Project, a simple Custom Activity and setup instructions are available on my GitHub site:

https://github.com/gbrueckl/Azure.DataFactory.CustomActivityDebugger
https://github.com/gbrueckl/Azure.DataFactory.LocalEnvironment

Feel free to use it as it is and/or extend it to your needs.

MDX Script Debugger – Beta-Release

I recently built a tool which should help to debug the MDX scripts of an Analysis Services cube in order to track down formula engine related performance issues of a cube. As you probably know most of the performance issues out there are usually caused by poorly or wrong written MDX scripts. This tool allows you to execute a reference query and highlights the MDX script commands that are effectively used when the query is run. It provides the overall timings and how long each additional MDX script command extended the execution time of the reference query. The results can then either be exported to XML for further analysis in e.g. Power BI or a customized version of the MDX script can be created and used to run another set of tests.

The tool is currently in a beta state and this is the first official release – and also my first written tool that I share publicly so please don’t be too severe with your feedback Open-mouthed smile  – just joking every feedback is good feedback!

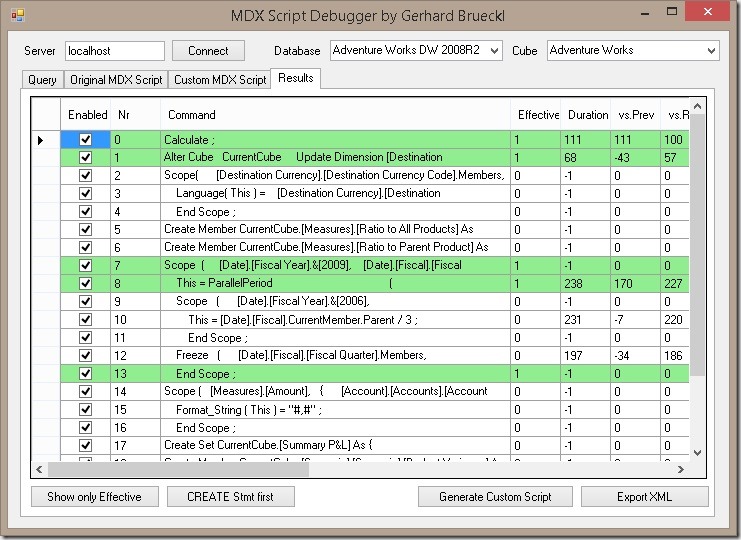
Below is a little screenshot which shows the results after  the reference query is executed. The green lines are effectively used by the query whereas the others do not have any impact on the values returned by the query.

ResultsView

A list of all features, further information and also the source code can be found at the project page on codeplex:
https://mdxscriptdebugger.codeplex.com/
Also the download is available from there:
https://mdxscriptdebugger.codeplex.com/releases

Looking forward to your feedback and hope it helps you to track down performance issues of your MDX Scripts!