I just came across this blog post by Bill Anton where he discusses several approaches to calculated the Median of a given set in T-SQL, MDX and DAX. In the end of his post when it comes to the DAX calculation, he references several post by Marco, Alberto and Javier (post1, post2) that already address that kind of calculation in DAX. But he also claims that non of the solutions is “elegant”. Well, reason enough for me to try it on my own and here is what I came up with. Its up to you to decide whether this solution is more elegant than the others or not 🙂
In general, the median calculation always varies depending on the number of items and whether this number is even or odd.
For an even population the median is the mean of the values in the middle:
the median of {3, 5, 7, 9} is is (5 + 7)/2 = 6
For an odd population, the median is the value in the middle:
the median of {3, 5, 9} is 5
In both cases the values have to be ordered before the calculation. Note that it does not make a difference whether the values are sorted in ascending or descending order.
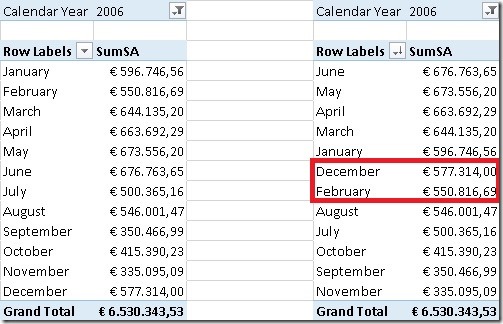
In this example, our set contains 12 items (=months) so we have to find the 2 items in the middle of the ordered set – December and February – and calculate the mean.
So, how can we address this problem using DAX? Most of the posts I mentioned above use some kind of combination of ranking – RANKX() – and filtering – FILTER(). For my approach I will use none of these but use TOPN instead (yes, I really like that function as you probably know if you followed my blog for some time).
In this special case, TOPN() can do both, ranking and filtering for us. But first of all we need to know how many items exist in our set:
This value will be subsequently used in our next calculations.
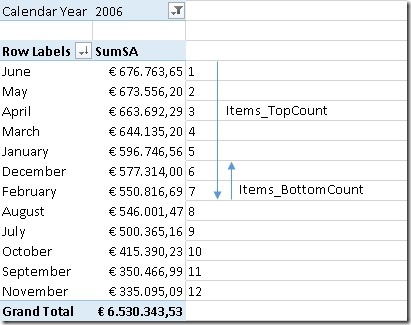
To find the value(s) in the middle I use TOPN() twice, first to get the first half of the items (similar to TopCount) and then a second time to get the last values that we need for our median calculation (similar to BottomCount):
As the median calculation is different for even and odd sets, this also has to be considered in our calculation. For both calculations MOD()-function is used to distinguish both cases:
([Cnt_Months] / 2) + 1,
([Cnt_Months] + 1) / 2)
For an even number of items (e.g. 12) we simply divide the count of items by 2 and add 1 which gives us a (12 / 2) + 1 = 7 for our sample.
For an odd number of items (e.g. 5) we first add 1 to our count of items and then divide by 2 which gives us (5 + 1) / 2 = 3
For an even number of items we have to consider the last 2 values whereas for an odd number of items we only have to consider the last value.
These calculations are then used in our median calculation:
TOPN(
[Items_BottomCount],
TOPN(
[Items_TopCount],
VALUES(‘Date’[Month]),
[SumSA]),
[SumSA] * -1))
/
[Items_BottomCount]
As DAX has no built-in BOTTOMN()-function, we need to “abuse” the TOPN() function and multiply the OrderBy-value by “–1” to get the BOTTOMN() functionality. As you can see most of the logic is already handled by our [Items_TopCount] and [Items_BottomCount] measures and this pattern can be reused very easily.
Of course all these calculations can also be combined and the use of IF() can be avoided:
TOPN(
2 – MOD([Cnt_Months], 2),
TOPN(
([Cnt_Months] + 1) / 2,
VALUES(‘Date’[Month]),
[SumSA]),
[SumSA] * -1))
/
(2 – MOD([Cnt_Months], 2))
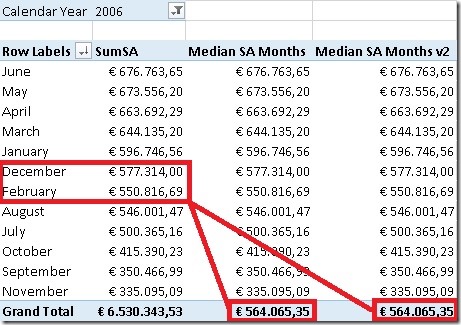
Note: for an even population ([Cnt_Months] + 1) / 2 returns X.5 which is automatically rounded up when it is used in a function that expects a whole number. In our example this is what happens: (12 + 1) / 2 = 6.5 –> 7
These are the final results:
Additional content:
We could also use AVERAGEX() to calculate our median but I think that it is some kind of overhead to use AVERAGEX() just to divide by “1” or “2” depending on the number of items that our TOPN-functions return:
TOPN(
2-MOD([Cnt_Months], 2),
TOPN(
([Cnt_Months] +1) / 2,
VALUES(‘Date’[Month]),
[SumSA]),
[SumSA] * -1),
[SumSA])
As you can see there are various approaches to calculate the median, its up to you which on you like most. I have not tested any of them in terms of performance over bigger sets – this may be topic for an upcoming post.
Download Final Model (Office 2013!)


