A very common requirement in reporting is to show the Top N items (products, regions, customers, …) and this can also be achieved in Power BI quite easily.
But lets start from the beginning and show how this requirement usually evolves and how to solve the different stages.
The easiest thing to do is to simply resize the visual (e.g. table visual) to only who 5 rows and sort them descending by your measure:
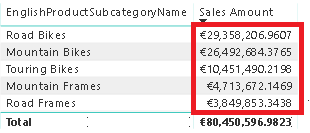
This is very straight forward and I do not think it needs any further explanation.
The next requirement that usually comes up next is that the customer wants to control, how many Top items to show. So they implement a slicer and make the whole calculation dynamic as described here:
SQL BI – Use of RANKX in a Power BI measure
FourMoo – Dynamic TopN made easy with What-If Parameter
Again, this works pretty well and is explained in detail in the blog posts.
Once you have implemented this change the business users usually complain that Total is wrong. This depends on how you implemented the TopN measure and what the users actually expect. I have seen two scenarios that cause confusion:
1) The Total is the SUM of the TopN items only – not reflecting the actual Grand Total
2) The Total is NOT the SUM of the TopN items only – people complaining that Power BI does not sum up correctly
As I said, this pretty much depends on the business requirements and after discussing that in length with the users, the solution is usually to simply add an “Others” row that sums up all values which are not part of the TopN items. For regular business users this requirement sounds really trivial because in Excel the could just add a new row and subtract the values of the TopN items from the Grand Total.
However, they usually will not understand the complexity behind this requirement for Power BI. In Power BI we cannot simply add a new “Others” row on the fly. It has to be part of the data model and as the TopN calculations is already dynamic, also the calculation for “Others” has to be dynamic. As you probably expected, also this has been covered already:
Oraylis – Show TopN and rest in Power BI
Power BI community – Dynamic Top N and Others category
These work fine even if I do not like the DAX as it is unnecessarily complex (from my point of view) but the general approach is the same as the one that will I show in this blog post and follows these steps:
1) create a new table in the data model (either with Power Query or DAX) that contains all our items that we want to use in our TopN calculation and an additional row for “Others”
2) link the new table also to the fact table, similar to the original table that contains your items
3) write a measure that calculates the rank for each item, filters the TopN items and assigns the rest to the “Others” item
4) use the new measure in combination with the new table/column in your visual
Step 1 – Create table with “Others” row
I used a DAX calculated table that does a UNION() of the existing rows for the TopN calculation and a static row for “Others”. I used ROW() first so I can specify the new column names directly. I further use ALLNOBLANKROW() to remove to get rid of any blank rows.
Subcategory_wOthers = UNION(
ROW("SubcategoryKey_wOthers", -99, "SubcategoryName_wOthers", "Others"),
ALLNOBLANKROW('ProductSubcategory'[ProductSubcategoryKey], 'ProductSubcategory'[SubcategoryName])
)
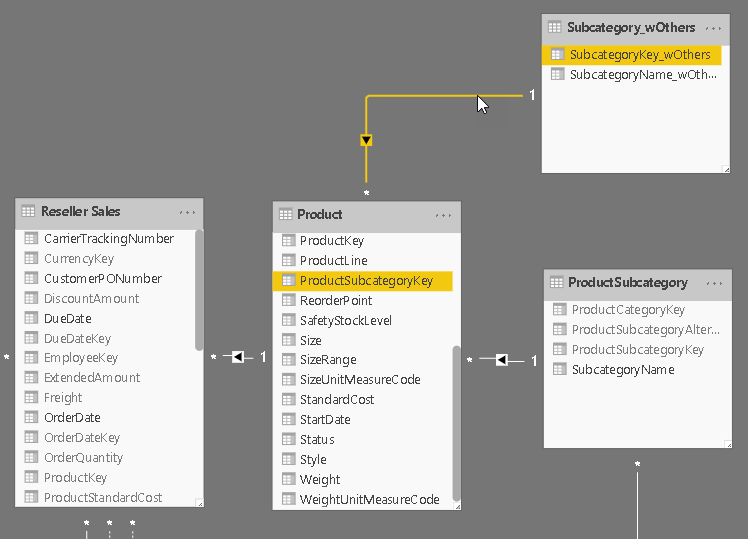
Step 2 – Create Relationship
The new table is linked to the same table to which the original table was linked to. This can be the fact-table directly or an intermediate table that then filters the facts in a second step (as shown below)
Step 3 – Create DAX measure
That’s actually the tricky part about this solution, but I think the code is still very easy to read and understand:
Top Measure ProductSubCategory =
/* get the items for which we want to calculate TopN + Others */
VAR Items = SELECTCOLUMNS(ALL(Subcategory_wOthers), "RankItem", Subcategory_wOthers[SubcategoryName_wOthers])
/* add a measure that we use for ranking */
VAR ItemsWithValue = ADDCOLUMNS(Items, "RankMeasure", CALCULATE([Selected Measure], ALL(ProductSubcategory)))
/* add a column with the rank of the measure within the items */
VAR ItemsWithRank = ADDCOLUMNS(ItemsWithValue, "Rank", RANKX(ItemsWithValue, [RankMeasure], [RankMeasure], DESC, Dense))
/* calculate whether the item is a Top-item or belongs to Others */
VAR ItemsWithTop = ADDCOLUMNS(ItemsWithRank, "TopOrOthers", IF([Rank] <= [Selected TopN], [RankItem], "Others"))
/* select the final items for which the value is calculated */
VAR ItemsFinal = SELECTCOLUMNS( /* we only select a single column to be used with TREATAS() in the final filter */
     FILTER(
         ItemsWithTop,
         CONTAINSROW(VALUES(Subcategory_wOthers[SubcategoryName_wOthers]), [TopOrOthers]) /* need to obey current filters on _wOthers table. e.g. after Drill-Down */
         && CONTAINSROW(VALUES(ProductSubcategory[SubcategoryName]), [RankItem])), /* need to obey current filters on base table */
     "TopN_Others", [RankItem])
RETURN
CALCULATE(
    [Selected Measure],
    TREATAS(ItemsFinal, Subcategory_wOthers[SubcategoryName_wOthers])
)
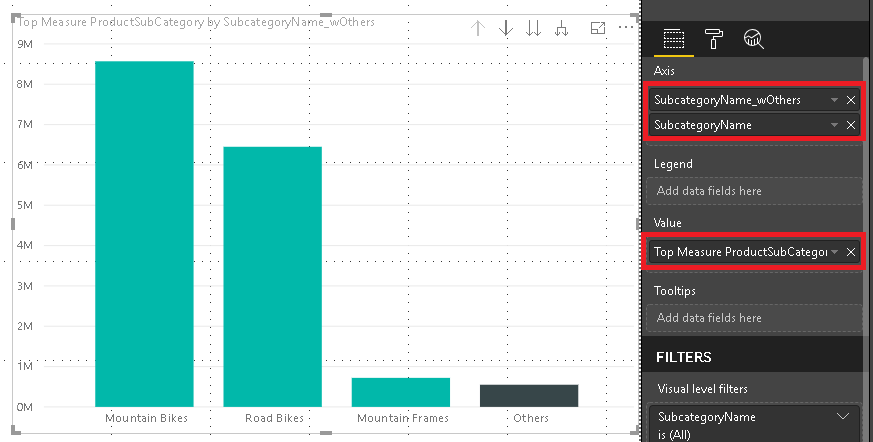
Step 4 – Build Visual
One of the benefits of this approach is that it also allows you to use the “Others” value in slicers, for cross-filtering/-highlight and even in drill-downs. To do so we need to configure our visual with two levels. The first one is the column that contains the “Others” item and the second level is the original column that contains the items. The DAX measure will take care of the rest.
And that’s it! You can now use the column that contains the artificial “Others” in combination with the new measure wherever you like. In a slicer, in a chart or in a table/matrix!
The final PBIX workbook can also be downloaded: TopN_Others.pbix
Hi there. I have been searching for how to do this with a tabular cube as my data source. I haven’t had any luck. Would you know how to implement, say top 10 and Others on a SSAS tabular cube?
Well, the approach is the very same as described in the blog post. Basically it is just DAX
However, you would need to know in advance for which table/column you want to calculate the Top N
Hi Gerhard,
Thank you for your response. Does that mean that I would have to perform that first step (create table with others row) in SSAS? Because in PowerBI desktop, the new table and new column icons are greyed out for me. I am learning Power BI on the fly so apologies if some of my questions aren’t very smart.
Yes, the table has to be created in SSAS, the measure could theoretically also be created in Power BI but i recommend to also do it in SSAS as they are strongly tied together
Thank you. Let me look into this. I appreciate your help
Pingback: Dynamic Top N in Power BI – Curated SQL
Pingback: Power BI App Nav, TopN, Report Server, Perf and more... (May 27, 2019) | Guy in a Cube
Good idea! One question… the last return part, can’t we just do:
SUMX(ItemsFinal, [RankMeasure])
This way we avoid recomputing the Measure using Treatas?
yes, that would of course also work and could potentially be faster – but you should test this on your dataset!
I just try to keep the formula generic so it does not just only work with SUM measures but basically with any kind of measures (e.g. think of DISTINCTCOUNT or AVERAGE)
Hey Gerhard, Thank you for this blog post! I wanted to know how can you make the surrounding visuals interactive with the “Others bar/slice”. For instance if when I select “Others” from the visual then I would want the surrounding visuals to filter based on the selection of “Others”.
well, you need to use the new measure (in my example [Top Measure ProductSubCategory]) also in the other visuals
then they should also get filtered accordingly
you can just download the sample .pbix at the end of the post and have a look
-gerhard
Here my issue. Say you wanted the selected measure to be Order Count. So you create a measure OrderCount = DISTINCTCOUNT(‘Reseller Sales'[SalesOrderNumber]) . When you try to use the “Top Measure ProductSubCategory” with the OrderCount measure as the selected measure the surrounding visuals don’t calculate correctly.
Link to screenshot: https://drive.google.com/file/d/0Bx8H0lmz4IM4c1VBLWdidVZTNHQzNmZkdkc5Zk5zMUk4R3Z3/view?usp=drivesdk
Link to pbix zip: https://drive.google.com/file/d/0Bx8H0lmz4IM4TmRyaTJGN2x0MFBhaElGd216OEtCWkNqOWo4/view?usp=drivesdk
hmm, that looks weird. The funny thing is it works for all other SubCategories except for Mountain Bikes
I will investigate and come back to you!
gerhard
Thank you Gerhard for looking into it. Note: Subcategory “Mountain Bikes” is not the only subcategory that is off. The “Others” subcategory are also off on the BusinessType table.
The “Others” subcategory bar calculates to 3368. While the BusinessType table when the “Others” bar is highlighted makes up a “false” total of 3319 when adding each BusinessType line item.
Brandon
ok so the problem is the following:
the measure is evaluated in the current context of each single Reseller’s Business Type.
for the Business Types “Warehouse” and “Value Added Reseller” the Subcategory “Mountain Bikes” is not in the Top 3 Subcategories of this Business Type hence it does not show a value if you filter globally for “Mountain Bikes”. For these two Business Types the Top3 Subcategories and “Mountain Bikes” are exclusive hence you see no value
to work around this, you would need to add ALL(Reseller) to the measures variable “ItemsWithValue”
VAR ItemsWithValue = ADDCOLUMNS(Items, “RankMeasure”, CALCULATE([Selected Measure], ALL(ProductSubcategory), ALL(Reseller)))
so the calculation does what it is supposed to but simply does not match your requirements as you need to specify exactly in which context you want to calculate the Top3 Items
-gerhard
Hey Gerhard,
first of all, thanks a lot for your detailed post!
I have two question regarding your post:
1. I tried to reproduce all your steps on my data set and all steps seem to work correctly until it comes to the visuals: Here, the “Others” Bar is never shown. Do you have an idea what the reason for this issue could be?
2. I had a look at the variable “Items” in your pbix file and I just don’t understand where the blank row on the bottom of the column comes from (since your original data do not contain any blanks).
Thanks a lot in advance. I highly appreciate your help!
Hi Benedikt,
regarding 1. – just make sure that you use the new table and not the original table that contains your items (or whatever it is in your case)
regarding 2. – well, if your original table contains a blank row, then also the new table which contains the additional “Others” item also contains the blank row
-gerhard
Hello Gerhard,
Thank you for this post. I have followed all the steps but I have the same problem: the “others” category is never shown, even though I am using the new table.
Hi Natt,
Did you also use the new measure?
it only works if you use the new table AND the new measure
otherwise send me the file and I will have a look
regards,
-gerhard
Hi,
I had the same issue:
1. I removed this condition on the final filter.
CONTAINSROW(VALUES(ProductSubcategory[SubcategoryName]), [RankItem])
All it seemed to do was filter out others from ItemsFinal.
You shouldn’t have to filter anyway as the selected measure should be accounting for any existing filters on the base table.
This means the subcategory is still listed but will have a zero value rank measure, would be ranked at the bottom and grouped into “Others”.
Hiding values with no data on the visualisation should remove them from drill down if you want to do that.
2. The blank row seemed to be introduced in the first virtual table:
VAR Items = SELECTCOLUMNS(ALL(Subcategory_wOthers), “RankItem”, Subcategory_wOthers[SubcategoryName_wOthers])
Even though SubcategoryName_wOthers had no blanks, the Items table did have a blank. No idea why.
I replaced it with:
VAR Items = SELECTCOLUMNS(ALLNOBLANKROWS(Subcategory_wOthers), “RankItem”, Subcategory_wOthers[SubcategoryName_wOthers])
And that seemed to work with no issues. Again, no idea why.
Thanks
Will
This is really great. I figured out how to sort the visual with Others always sorted to the bottom. I did this by creating another [TopOtherRank] measure almost the same as your original, but with the RETURN part being
IF( HASONEVALUE( Subcategory_wOthers[SubcategoryName_wOthers] ), FIRSTNONBLANK(SELECTCOLUMNS( ItemsFinal, “Rnk”, [Rank] ), TRUE() ), BLANK() ). Might be useful to someone!
Thanks David, very helpful!
David,
I do need the Others group sorted to the bottom no matter what, thx for posting your code but not sure
How exactly your code chunk above will fit into the original measure? Since ItemsFinal doesn’t have the [Rank] column?
If you don’t mind, could you post the complete measure code?
Have you found a solution for this?
why doesnt the solution provided by David work for you?
We are wondering where exactly to insert this in the original code?? IF( HASONEVALUE( Subcategory_wOthers[SubcategoryName_wOthers] ), FIRSTNONBLANK(SELECTCOLUMNS( ItemsFinal, “Rnk”, [Rank] ), TRUE() ), BLANK() )
where is that piece of code coming from?
from David Cadman on 2019-10-30 at 16:09 said:
This is really great. I figured out how to sort the visual with Others always sorted to the bottom. I did this by creating another [TopOtherRank] measure almost the same as your original, but with the RETURN part being
IF( HASONEVALUE( Subcategory_wOthers[SubcategoryName_wOthers] ), FIRSTNONBLANK(SELECTCOLUMNS( ItemsFinal, “Rnk”, [Rank] ), TRUE() ), BLANK() ). Might be useful to someone!
P.S
Is there a way to increase the performance of your original code in the Top Measure SubProductCstegory measure?
proper ranking is definitely a great addition – though it will further slow down the query as it also has to evaluate the ranking measure
in general, the measure is already quite compute-intense due to the sorting it has to do internally. Especially when the number of your items is large (5000+) this can become problematic but I have not found a way yet to improve the performance, sorry
From David Cadman on 2019-10-30 at 16:09 said:
This is really great. I figured out how to sort the visual with Others always sorted to the bottom. I did this by creating another [TopOtherRank] measure almost the same as your original, but with the RETURN part being
IF( HASONEVALUE( Subcategory_wOthers[SubcategoryName_wOthers] ), FIRSTNONBLANK(SELECTCOLUMNS( ItemsFinal, “Rnk”, [Rank] ), TRUE() ), BLANK() ).
So this is probably a stupid question… I was able to create the order measure, but how do I implement this for a matrix visual?
Hi Dan,
depending on your matrix visual, if you have column fields, it does not support sorting. But this has nothing to do with the DAX measures described here but only with the visual you use
kind regards,
-gerhard
thanks david, Could you please elaborate on how i can create Top Othe Rank. ?
Hi David,
Please the TopN is not interacting with my Visual.
I have checked and double – checked my codes, I can’t place my hand on the error. Please I would appreciate your kind assistance.
Best Regards,
Eghosa
Hi Eghosa,
sure, just drop me a mail and attach the PBIX workbook
kind regards,
-gerhard
Thanks, I really appreciate. PBIX Workbook sent to your mail
Hi Gerhard,
Nice post.
1.The link to your ‘TopN_Others.pbix’ no longer works.
2. If I wished to add an additional slicer that allowed the user to show either TopN or BottomN values … How would I do this?
Thanks
Hi Steve,
just tested the download and it worked just fine for me as it is – can you try again please?
If you want to have a dynamic TOP/FLOP N via a slicer I would probably add a new table with values
TopFlop | Multiplier
TOP | 1
FLOP | -1
create a measure TopFlop_Multiplier=MAX(TopFlopTable[Multiplier]) and then add this measure to the original formula.
The slicer will then simply reverse the ordering within the calculation and allows you to easily switch between TOP and FLOP N
kind regards,
-gerhard
Thanks for the prompt reply.
1. Download works in Chrome, and Edge but when using Firefox it tries to save as a text file. No idea why.
2. Where in the original formula do I add the measure?: TopFlop_Multiplier=MAX(TopFlopTable[Multiplier])
Gerhard,
First of all, thank you very much for this article and for publishing your solution.
I’m playing with your pbix and trying to understand the measure. I added a slicer on ProductSubcategory[SubcategoryName] = Mountain Bikes, Mountain Frames, hereafter (MB, MF).
I particularly don’t understand the “ItemsFinal” step within the measure.
When I try to debug the table variable ItemsFinal in DAX Studio with the filter on ItemsWithTop commented out completely, it has the same results as when I evaluate ItemsFinal with the original code. Yet, the results of the measure are different. Why is this?
What’s particularly strange to me is the table variables are derived from Subcategory_wOthers and in this step you are using that same table as filtering criteria. I suspect I don’t fully comprehend how table variables behave.
You try to explain what this line of code does, but can you expound on this?
CONTAINSROW(VALUES(Subcategory_wOthers[SubcategoryName_wOthers]), [TopOrOthers]) /* need to obey current filters on _wOthers table. e.g. after Drill-Down */
I believe VALUES(Subcategory_wOthers[SubcategoryName_wOthers]) in this slicer context are MB and MF, so when we filter TopOrOthers only the ‘MB’ row will be found because MF has a value of “Others”, right?
What part of the code handle the calculation for the Others subtotal?
I understand the final step with the TreatAs to be, “whatever RankItems are selected in ItemsFinal, apply that filter to Subcategory_wOthers[SubcategoryName_wOthers]”. I suppose in my scenario, RankItems has to be MB, MF, and Others?
Thank you very much for the clarification, sorry for all the questions.
Hi Dan,
If I remember correctly, this was necessary in case you drill-down from Subcategory_wOthers to Subcategory. Without the filter it would produce wrong results because some filters would be overwritten.
kind regards,
-gerhard
Could anyone walk me through a specific scenario where the results break if this is commented out?
&& CONTAINSROW(VALUES(ProductSubcategory[SubcategoryName]), [RankItem]))
well, there is a reason why this filter is in there.
Why do you want to remove it?
well, there is a reason why this filter is in there.
why do you want/need to remove it if it breaks the results?
Good Day Gerhard,
Thanks for this post!
Your solution works perfectly on both Top N and Others & Bottom N and Others. However visual refresh is toooooo slow about 18 secs every time we click on drill down.
Data is huge, I need Top 10/ Bottom 10 Customers and Rest in Others. Customer list is 250,000 and Actual data is huge. Client want Area wise Top/Bottom 10 in Matrix.
I searched for similar solutions works perfectly and faster but only Customers are used, if add Area in Matrix doesn’t give perfect results.
Any thoughts?
Appreciate your help on his
Regards
Nasir Shaikh
Hi Gerhard,
Thank you for share your knowledge, the code work perfectly but when i add the column year, the filter hasn’t work, i need help in this case. I want to represent all years in the same table.
actually, If you simply place “Year” on an axis of your chart (or “on columns” of your table) the code should just work – at least if “Year” comes from a separate table that is only linked to your facts
is this the case or does your Year-column belong to the TopN dimension or the facts?
Hi Gerhard,
Thank you so much for sharing such a great article, I got it from Curbal YouTube channel. your code worked for me, but I have a question, now If I my selected Measure “Order Quantity” is associated with another column “Unit of Measure” for different products. so I have some Products have unit of measure in Liter, others have unit of measure in KG. how to get the TOPN + Others for each specific unit of measure?
Regards,
Mohamed.
well you would need a dedicated column which contains the unit only (e.g. “liters”, “KG”, …) and then simply use it in a filter
this should work but may also depend on your data model and table structures
This is an amazing post! I have a model with lost of inactive relationships, so my end result got much longer, but I made it!
I was able to debug it easily by running ADDCOLUMNS steps of the measure as a calculated table, and putting the variable for each step in the return. Allowed me to find out where I was going wrong – and get it fixed. ?
Thank YOU!
This works for my top 20 Institutions but does not populate for others. I think it is because I am using a matrix and have the Year in the columns. Is there a filter or summary I can add to populate the others and leave the Top 20 institutions the way they are?
you could probably add an ALL() for your year (or whatever you have on columns/rows) to the calculation to ignore this filter
Hi Gerard, thank you for the lovely post, I have a similar requirement if you could please help
1) Show the selected items in the slicer at the top of the report
2)disable the drill down for all but others
To show the selected items you can use a DAX measure
Drill down cannot be disabled but you could try to set the value to Blank() if the SELECTEDVALUE() of both levels match
Hi Gerhard,
This is amazing, very helpful thank you so much.
Thanks to Curbal for introducing “blog.gbrueckl.at” to me.
Regards
Majid H. Baluch
Hi Gerhard,
Thank for your great post.
It would be grateful if you could help me to make hierarchy Top N and other.
In top N/others category, it should be able to drill down.
Any help is highly appreciated.
like a native hierarchy? having the two fields in the same table?
dont know if thats possible, it is at least not easy
I will wrap my head around it and come back to you here if I actually find a solution
-gerhard
Thank Gerhard for your kind help!
If you came up with a solution on your own it would be great if you could share it here
Hi there, great post.
I am trying to show top n items but also always include 1 or 2 specific items.
i.e.
Company A
Company B
Rank 1 (or 2/3 if 1 is A or B)
Rank 2 ( or 3/4 if 1 or 2 is A or B)
Many thanks if you are able to help
You can try to add another sort-epxression within RANKX which is 1 for Company A and Company B and 0 for all other companies
if you use this as first sort-criteria in RANKX and the actual measure as a second, it should always return the two companies following the top N others
regards,
-gerhard
Hi Gerhard,
I really like this solution, thank you for posting it and actively replying. I noticed up in the comments, some one else had a similar issue that I am facing. Everything seems to work, except on my visual I never see the “Other” grouping. I have chosen my “topN” dimension as the axis in my visual. I have also chosen my new measure as the values.
I also am only using only the dimension I used to create all of these in my case – product market. I saw above, the person needed to add another dimension to the itemvalues variable.
Anyhow, I feel a bit stuck. I am happy to send my pbi book to you if you’re feeling charitable enough to take a look. Thank you!
Eric
sure send it over and I will have a quick look
you can use the contact form at https://blog.gbrueckl.at/about/
regards,
-gerhard
So interestingly, I was able to get this to work by commenting out the second CONTAINSROW expression in the code that produces ItemsFinal….
VAR ItemsFinal = SELECTCOLUMNS( /* we can only select a single column to be used with TREATAS() */
FILTER(
ItemsWithTop,
CONTAINSROW(VALUES(ProductMarketTopN[ProductMarketTopN_Name]), [TopOrOthers])), /* need to obey current filters on _wOthers table. e.g. after Drill-Down */
//&& CONTAINSROW(VALUES(‘edw dimProductMarket'[ProductMarketDescription]), [RankItem])), /* need to obey current filters on base table */
“TopN_Others”, [RankItem])
The only difference between my solution and yours is my ProductMarketTopN table hangs directly off of my fact, rather than filtering a dimension that hangs off of the fact. Do you think this has anything to do with needing to remove that line?
I would think the expression I removed would in fact filter rows that had “Others” because my base dimension does not contain the value “Others”. But on the other hand, neither does yours.
I would love any input you’re able to provide. I don’t like just removing things and saying *it works*without understanding 🙂
Thanks again!
Eric
It at least appears that removing that row has removed my ability to “drill down” into the “Others” category… So there’s that. 🙁
the calculation is in this case is very specific to the data model so if your data model is only slightly different, it may not work.
Is there any particular reason why you cannot use the same data model as I did in the post?
-gerhard
Hi Gerhard,
Thanks again for working with me on this.
Your solution was elegant and simple enough, that I did not see a need to recreate the same thing in the same data model, just to prove I could. I am delivering work to a client that wants this functionality, so I built it using their data and model.
That said, I have solved the problem. It appears this solution relies pretty heavily on the top n dimension being an outrigger or snowflake off of a dimension that filters the fact, rather than the top n dimension filtering the fact directly. I understand better now why. After making my model do it this way, everything works exactly as yours does.
Thanks again for an awesome solution and chatting about it.
Eric
great that you could finally solve your issue!
-gerhard
Hi Gerhard,
First of all thank you for your blog.
I wanted to implement the dynamic TopN + Others on one of my data sets and have followed step by step the process in your blog.
However, the “Others” bar is not appearing in my charts / visualizations.
After reading the comments on the blog, I tried removing “&& CONTAINSROW(VALUES(ProductSubcategory[SubcategoryName]), [RankItem])” from the ItemsFinal code to check if it works. This worked only when there are no slicers. However when I introduce a slicer, the coding does not work.
I have spent hours trying to figure out my mistake but am unable to do so.
I relatively new to PowerBI and have a simple dataset.
What do you think the error could be? Would it be possible to send the .pbix file to you for a quick look.
Appreciate your help.
Kind regards,
Mufadhal
you can use the contact form to send the .pbix over then I can have a quick look
https://blog.gbrueckl.at/about/
Hi
I am having similar issue in my report where I have to find out Top5 and Others in a piechart. Thing is that I am unable to get the totals for Others using your approach.It is showing 0 as value for Others but i should be getting value excluding Top 5
Regards
Arun
please verify that your data model is set up the same way as the one in the blog – especially with regards to relationships!
if this is the same and you use the DAX code i provided, I am sure it will also work for you
please make sure that your data model – especially relationships! – are the same as in my example and that you also use the same DAX
you can also download my sample and try to reverse-engineer it
-gerhard
Is there a way to increase the performance of this measure?
I used this example for my own visuals using another dataset with multiple columns of this measure in a matrix the performance becomes very slow or doesn’t render at all due to lack of memory.
well, the calculation can be quite expensive especially if the number of your items is 10000+
what exactly do you mean by “multiple columns of this measure”?
are you combining two TopN calculations?
-gerhard
I’ve created multiple measures using your formula a measure for CurrentYear, PreviousYear, Planned, etc. and insert hem into a matrix the performance is affected and might be causing the visual to exceed the available resource in Power BI Service.
again, the calculation is quite compute-intense – if you mix multiple of those measures/columns it will get even worse
Hello Gerhard!
Thanks for the solution. In my case the programm says that it can not find this:
[Selected TopN), [RankItem]
What is it refering to?
Thanks in advance!
Regards!
Oksana
I think there was an issue when you copy&pasted the DAX code
you maybe try to download the sample workbook and try it from there
The code itself as it is shared here works as it is the same as in the PBIX file
Hello Gerhard!
Thanks for the solution. In my case the programm says that it can not find this:
[RankItem]
What is it refering to?
Thanks in advance!
Regards!
Oksana
I just tested it again with the attached pbix file and it works as expected
also the code in the post is the same as the one in the pbix file
are you maybe using Power Pivot in Excel?
Hey Gerhard,
First and foremost, thank you very much for your post.
I stuck with reproducing you report following all your steps in a simple small data set. Not only does it not show the top N and others in the horizontal axis, it would not apply any filter to the data base on time filter.
my data set has 4 products in a period of 5 months and a randomly generated sale amount:
| time | Product | Sale |
|—————-|————|——- |
2023-01-05 | a | 100
2023-01-05 | b | 150
2023-01-05 | c | 170
2023-01-05 | d | 130
—————————————-
Thanks a lot in advance. I really appreciate your help!
I’d recommend to download the PBIX at the end of the post and play around with it/change it to your needs to understand the concepts and have some “playground”
afterwards I am sure you can also apply it to your final dataset
Hello Gerhard
I am having a similar problem in my report where I have to find out TopN and Other in a bar chart. What happens is that I can’t get the row of Others using your approach, it doesn’t appear in the table. I have reviewed the PBIX that is in the publication and I noticed that my data model is different from the one I have, could that be the error for which does not show me the row Others?? Thank you very much, I will be attentive to your answer.
Greetings
Amada
well, the logic is very sensitive and expect some specific setup in terms of tables and relationships, so yes, it is probably related to your model being slightly different then mine
you either need to change your model to match mine or update the DAX so it also works with your model (if its possible at all)
-gerhard
Hello Gerhard
first of all I want to thanks for your help. I use it to my project. I have a Small issue. even in your pbix, when I add a card with the measure sales amount. and when I drill down the others in the bar chart it shows blank. I don’t know how I solve it.
you need to use the new “Top Measure ProductSubCategory” otherwise it will not be filtered by the selection of “Others”
Hi,
How would you suppress Others if the number of values in the table after filtering is less than N. I have a table with 100 clients in total. I have set N to be 10. If I filter by a certain Client Type then I only have 5 Clients in that case I do not need to show Other only show all 5 Clients.
hmm, does Others really show then as it should have an empty value and Power BI should hide the row automatically
Hi,
I’ve seen similar solutions to this problem based on topX, but in my case, I need to rely on quantity—specifically, I want values below 10 to be aggregated into an “Others” group.
Additionally, I’m not only dealing with subcategories but also with main categories, which I’d also like to aggregate. So after drill-down main category “others” I want to see “others” subcategory if there is quantity below 10
Do you have any ideas on how to achieve this?
should be possible by exchanging the TOPN with a simple FILTER but I have not tested this yet