Recently when browsing the MSDN PowerPivot Forums I came across this thread where the question was ask on how to show the value which is directly linked to an element in a parent-child hierarchy instead of the aggregation of all "children". In this post I am going to address this problem finally showing a proper solution.
First of all I would like to start with some background to so called "datamembers". The term "datamember" originates from parent-child hierarchies in multidimensional models. It is a dummy-member that is created automatically below each hierarchy-node to hold values that are linked to a node-member directly. This is of course only possible for parent-child hierarchies.
Take the following MDX-Query for example:
[Measures].[Sales Amount Quota] ON 0,
Descendants(
[Employee].[Employees].&[290],
1,
SELF_AND_BEFORE) ON 1
FROM [Adventure Works]
WHERE [Date].[Calendar].[Calendar Year].&[2006]
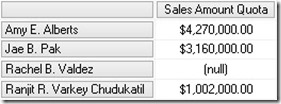
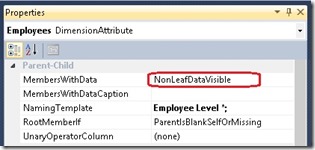
As we can see, the value of "Amy E. Alberts" is not the Sum of its children but has a difference of $108,000.00 This difference is because of the "datamember" that is also a child of every parent-child node which may be hidden. For multidimensional models his behavior can be changed by setting the MembersWithData-Property to "NonLeafDataVisible":
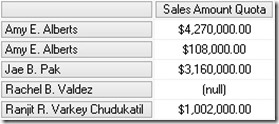
Executing the same query again we now get this results:
Now we see "Amy E. Alberts" twice – the node and the datamember.
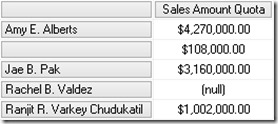
Doing a similar query on a tabular model we will get this result by default:
As you can see, we still have the datamember but without any caption. Though, this can of course be changed when you flatten out the hierarchy using DAX by simply replacing BLANK() by "<my datamember caption>" in your calculated columns.
Anyway, this is not the topic of this post but just some background information. Now we will focus on how to query data that is directly associated to a node or its corresponding datamember in MDX and DAX.
MDX:
For MDX this is quite easy as the datamember can be referenced by simply using ".datamember" of a given hierarchy node:
MEMBER [Measures].[DataMember] AS (
[Measures].[Sales Amount Quota],
[Employee].[Employees].currentmember.datamember
), FORMAT_STRING = 'Currency'
SELECT
{
[Measures].[Sales Amount Quota],
[Measures].[DataMember]
} ON 0,
Descendants(
[Employee].[Employees].&[290],
1,
SELF_AND_BEFORE) ON 1
FROM [Adventure Works]
WHERE [Date].[Calendar].[Calendar Year].&[2006]
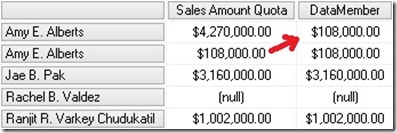
The DataMember-Measure only shows values that are directly linked to the current node of the parent-child hierarchy. This is pretty straight forward and very easy to accomplish.
DAX:
In this DAX this problem is a bit more tricky as we do not have that built-in ".datamember" function. Also navigation within hierarchies and parent-child hierarchies itself are not really supported in DAX. Though, there are several blogs out there that describe how to handle parent-child hierarchies by Alberto Ferrari (here) and Kasper de Jonge (here). Based on these solutions we can create our datamember-calculation.
First (and only) thing we need is to add a calculated column that stores the path depth of the current row. This can be achieved by using this formula:
PATH(
Employee[EmployeeKey],
Employee[ParentEmployeeKey]
)
)
Using our previous example and selecting "Amy E. Alberts" together with our new column we get this:
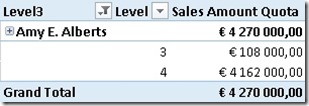
As we can see there are two different Levels below "Amy E. Alberts" where Level=3 holds our datamember-value and Level=4 holds all the other values (=real child members). Lets add a calculated measure to help you make the final calculation more understandable:
So, for our [DataMember]-calculation we simply have to extend the context to only include rows where [Level] = [MinLevel]
SUM('Sales Quota'[Sales Amount Quota]),
FILTER('Employee',
'Employee'[Level] = [MinLevel]))
Well, obviously our calculation is not returning the expected results. This is because of a very common pitfall which I am also very prone to. Whenever a calculated measure is used within an other calculated measure, a CALCULATE() gets wrapped around it thereby taking over the current context. In our case this means that ‘Employee'[Level] will always be the same as [MinLevel] as [MinLevel] gets evaluated for each row and doing MIN() on only one row of course always returns the value of the current row which we compared it to!
To solve this issue we have to place the original [MinLevel]-calculation directly into our [DataMember]-calculation:
SUM('Sales Quota'[Sales Amount Quota]),
FILTER('Employee',
'Employee'[Level] = MIN(Employee[Level])))
This change finally makes the calculation return the correct results also when browsing using the hierarchy:
Even though DAX is not very good in handling hierarchies, the [DataMember]-calculation can be accomplished quite easily. This calculation also works for hierarchies of any depth without needing to adopt it. In terms of performance it may be further improved to the following formula – though the impact will be minor:
SUM('Sales Quota'[Sales Amount Quota]),
FILTER(VALUES('Employee'[Level]),
'Employee'[Level] = MIN(Employee[Level])))
Download Final Model (Office 2013!)


Pingback: Hot July 2013 for #msbi content–Selected posts & news on #ssas #powerbi #powerview | Rui Quintino Blog
Hi Gerhard,
I’m just working on an employee hierarchy, and am trying to control how it displays on a pivot table. From what I can see from your article you can control the data member so that it shows the correct totals and individual contributions separately.
However I also want to be able to suppress the (blank) values in the hierarchy as per alberto Ferraris article on hierarchies in denali, and in doing so the data member values are blanked.
Is it possible to use your solution in conjunction with albertos to suppress the blanks and still show the members contribution?
Hi Dan,
first of all you need a [BrowseDepth]-measure just as described in Albertos blog
then you can change the calculation as follows:
DataMember4:=CALCULATE(
SUM(‘Sales Quota'[Sales Amount Quota]),
FILTER(VALUES(‘Employee'[Level]),
‘Employee'[Level] = [BrowseDepth] ))
this will Limit the returned rows only to rows that are associated with the current element but not with ist children
does this solve your issue?
-gerhard
Gerhard,
thanks for the help, it was very useful to get the individual calculation. I was also wondering if you could help with another problem. We would like to be able to calculate the sum of all the individual values on just the descendents, which works within and outside of the hierarchy. It may be 2 separate calculations, one dependent on the BrowseDepth and the other which filters the employees to those with a Path containing a specific value.
Thanks
Dan
would it be enough to simply Change the filter-criteria to “>” instead of “=” ?
this should give you all descendants without the node itself
This is incredibly helpful; I’d been searching for I don’t know how long to find a method for dealing with recursive hierarchical differences – this was exactly what I was looking for – thank you!
I, like dan, was wanting to take the ragged hierarchy into something much more sophisticated, and strip the (blank) out of the results. I could never get the subtotals to compute correctly however.
Your original method created a correct subtotal, but something like this
Consumer $36,088
(blank) $36,088
Global Customer Fulfillment $433
Global Inventory Platform $0
International Retail $1
NA Retail $34,946
(blank) $34,946
Subsidiaries $34,783
VP Other $163
VP Shure $5
VP Suresh $3
It’s great, because the math works, but sad, because of the big fat (blank) entries.
My measure (in Excel 2013, using a sparse matrix as a datasource) looks like:
=CALCULATE(
SUM(‘Table1′[billed_amount])/2,
FILTER(VALUES(Table1[Depth]),
‘Table1′[Depth] = MIN(Table1[Depth])))
If I combine the alteration you suggested above, I get this:
Consumer $143,391
Global Customer Fulfillment $869
Global Inventory Platform $0
International Retail $1
NA Retail $105,006
Subsidiaries $69,569
VP Other $492
VP Shure $0
VP Suresh $0
The measure is:
=CALCULATE(
SUM(‘Table1′[billed_amount])/2,
FILTER(VALUES(Table1[Depth]),
‘Table1′[Depth] > Table1[BrowseDepth]))
The thing I observed while writing this, is that the numbers in the second example are multiples of the first set. They’re also multiples that directly correspond to the Min[depth]. That is to say, if the minimum value of the [depth] (which is outlined here http://sqlblog.com/blogs/alberto_ferrari/archive/2011/07/18/parent-child-hierarchies-in-tabular-with-denali.aspx), is 3, the value in the 2nd set is 3x that of the 1st set.
I can’t figure this out, and I’m sure it’s something simple.
Anyway, I do thank you for the first part. If you could develop a clean workable solution to incorporate the second thing, that would be something to behold.
Thank you!
what does your Fact-data look like? do you have the nodes total value (sum of children) in your fact-table?
Is it possible to subtract “children” from their “parents” with DAX?
Hi Sergey,
I am not quite sure what exactly you want to achieve. Subtract the “children” from their “parent” would result in 0 all the time – assuming the datamember is in your terms also a “child”. how to get the value of the datamember I just showed in this post.
Is there any specific scenario you are referring to?
-gerhard
Very descriptive post, I liked that bit. Will there be
a part 2?
What would you expect from a part 2?
any specific scenario?
Thanks for the article, especially the last tip of using
FILTER( VALUES( [Level])…
instead of filtering through the entire table. I had a six fold decrease in refresh time in a BOM that about 10k nodes.