I recently had to build a tabular model for a financial application and I would like to share my findings on this topic in this post. Financial applications tend to have “Periods” instead of dates, months, etc. Though, those Periods are usually tied to months – e.g. January = “Period01”, February = “Period02” and so on. In addition to those “monthly periods” there are usually also further periods like “Period13”, “Period14” etc. to store manually booked values that are necessary for closing a fiscal year. To get the years closing value (for a P&L account) you have to add up all periods (Period01 to Period14). In DAX this is usually done by using TOTALYTD() or any similar Time-Intelligence Function.
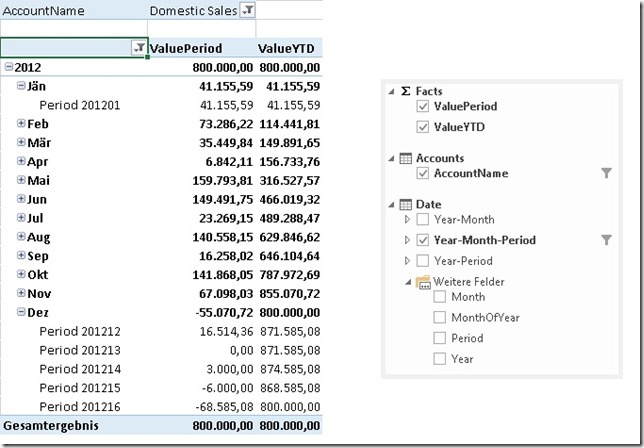
Here is what we want to achieve in the end. The final model should allow the End-user to create a report like this:
This model allows us to analyze data by Year, by Month and of course also by Period. As you can see also the YTD is calculated correctly using DAX’s built-in Time-Intelligence functions.
However, to make use of Time-Intelligence functions a Date-table is required (more information: Time Intelligence Functions in DAX) but this will be covered later. Lets start off with a basic model without a Date-table.
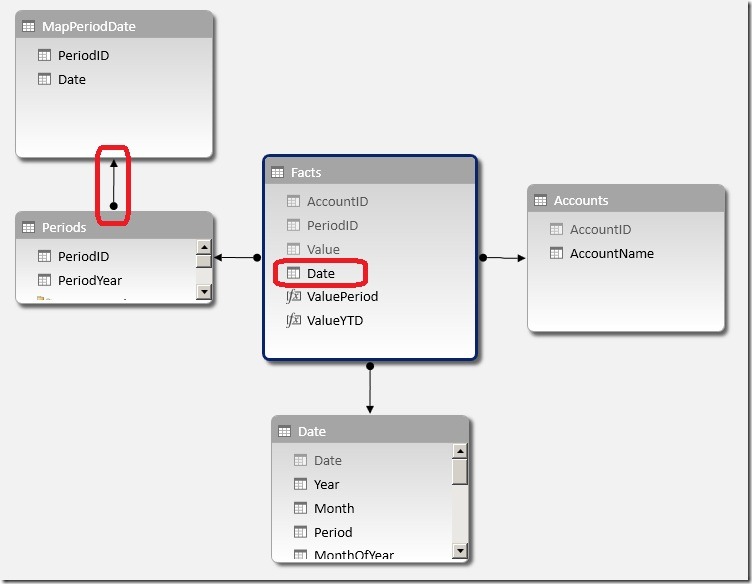
For testing purposes I created this simple PowerPivot model:
Sample of table ‘Facts’:
| AccountID | PeriodID | Value |
| 4 | 201201 |
41,155.59 |
| 2 | 201201 |
374,930.01 |
| 3 | 201211 |
525,545.15 |
| 5 | 201211 |
140,440.40 |
| 1 | 201212 |
16,514.36 |
| 5 | 201212 |
639,998.94 |
| 3 | 201213 |
-100,000.00 |
| 4 | 201213 |
20,000.00 |
| 5 | 201214 |
500,000.00 |
The first thing we need to do is to add a Date-table. This table should follow these rules:
– granularity=day –> one row for each date
– no gaps between the dates –> a contiguous range of dates
– do not use use the fact-table as your date-table –> always use an independent date-table
– the table must contain a column with the data type “Date” with unique values
– “Mark as Date-table”
A Date-table can be created using several approaches:
– Linked Table
– SQL view/table
– Azure Datamarket (e.g. Boyan Penev’s DateStream)
– …
(Creating an appropriate Date-table is not part of this post – for simplicity i used a Linked Table from my Excel workbook).
I further created calculated columns for Year, Month and MonthOfYear.
At this point we cannot link this table to our facts. We first have to create some kind of mapping between Periods and “real dates”. I decided to create a separate table for this purpose that links one Period to one Date. (Note: You may also put the whole logic into a calculated column of your fact-table.) This logic is straight forward for periods 1 to 11 which are simply mapped to the last (or first) date in that period. For Periods 12 and later this is a bit more tricky as we have to ensure that these periods are in the right order to be make our Time-Intelligence functions work correctly. So Period12 has to be before Period13, Period13 has to be before Period14, etc.
So I mapped Period16 (my sample has 16 Periods) to the 31st of December – the last date in the year as this is also the last period. Period 15 is mapped to the 30th of December – the second to last date. And so on, ending with Period12 mapped to the 27th of December:
| PeriodID | Date |
| 201101 | 01/31/2011 |
| 201102 | 02/28/2011 |
| 201111 | 11/30/2011 |
| 201112 | 12/27/2011 |
| 201113 | 12/28/2011 |
| 201114 | 12/29/2011 |
| 201115 | 12/30/2011 |
| 201116 | 12/31/2011 |
| 201201 | 01/31/2012 |
| 201202 | 02/29/2012 |
I called the table ‘MapPeriodDate’.
This table is then added to the model and linked to our already existing Period-table (Note: The table could also be linked to the Facts-table directly using PeriodID). This allows us to create a new calculated column in our Facts-table to get the mapping-date for the current Period:
The new column can now be used to link our Facts-table to our Date-Table:
Please take care in which direction you create the relationship between ‘Periods’ and ‘MapPeriodDate’ as otherwise the RELATED()-function may not work!
Once the Facts-table and the Date-table are connected you may consider hiding the unnecessary tables ‘Periods’ and ‘MapPeriodDate’ as all queries should now use the Date-table. Also the Date-column should be hidden so the lowest level of our Date-table should be [Period].
To get a [Period]-column in our Date-table we have to create some more calculated columns:
= LOOKUPVALUE(MapPeriodDate[PeriodID], MapPeriodDate[Date], [Date])
this returns the PeriodID if the current date also exists in the MapPeriodDate-table. Note that we only get a value for the last date in a month.
= CALCULATE(MIN([Period_LookUp]), DATESBETWEEN('Date'[Date], [Date], BLANK()))
our final [Period]-calculation returns the first populated value of [Period_LookUp] after the current date. The first populated value for dates in January is the 31st which has a value of 201101 – our PeriodID!
The last step is to create our YTD-measures. This is now very easy as we can again use the built-in Time-Intelligence functions with this new Date-table:
And of course also all other Time-Intelligence functions now work out of the box:
All those calculations work with Years, Months and also Periods and offer the same flexibility that you are used to from the original financial application.
Download Final Model (Office 2013!)


very timely knowledge, for my Tabular projects. 🙂 thx Gerhard — keep up the nice work of sharing your knowledge!!
Pingback: Equivalent of VLOOKUP in DAX–Part I « The Data Specialist
Pingback: Equivalent of VLOOKUP in DAX – Part II – using TOPN | The Data Specialist
Gerhard, good day!
If today is 30/07/2014, and we have fact table with sales from jan to 30/07/2014 how can we get previous year sales from jan to 30/07/2013?
thank you!
you would basically use a combination of TOTALYTD() and SAMEPERIODLASTYEAR() like this:
PrevYearYTD:=
TOTALYTD(
SUM(‘Facts'[Value]),
SAMEPERIODLASTYEAR(‘Date'[Dates]))
does this solve your issue?
-gerhard
Gerhard, thank you!
1. today is 01 august 2014 (1/8/14)
2. my facts have data from 1/1/13 to 1/8/14
3. DimDate has data from 1/1/13 to 1/1/15
4. pivot table has datekey from DimDate on rows
5. TOTALYTD and PrevYearYTD (your measure) have values in every cell of pivot table
6. All I want is no value of PrevYearYTD in every cell of pivot table after 1/8/14
may i send you a file?
please, give me a hint
thank you
mikhail
in this case you need to wrap an IF around your measures and check if the selected day is after the last day in your facts)
MyNewYTD:=IF(MAX(‘Date'[Date]) <= CALCULATE(MAX('Facts'[Date], ALL('Facts')),
hth,
gerhard
Gerhard,
I’ve wanted Running Total YoY too, your measure is what I looking for!
thank you very much!
Can I use the DAX functions where our fiscal calendar is different? Ours goes by weeks, 5,44, so the calendar month is not always the fiscal month.
sure, you just need to map your periods to the correct date-value
your first period would then map the last day of the 5th week in the particular year,
your second period would map to the last day of the 9th week in the particular year,
and so on
Do I need to name my columns in my date table with fixed names like FiscalYear, FiscalQtr in order it to know?
that would make sense to distinguish the column from your calendar year/calendar quarter