I just came across this blog post by Bill Anton where he discusses several approaches to calculated the Median of a given set in T-SQL, MDX and DAX. In the end of his post when it comes to the DAX calculation, he references several post by Marco, Alberto and Javier (post1, post2) that already address that kind of calculation in DAX. But he also claims that non of the solutions is “elegant”. Well, reason enough for me to try it on my own and here is what I came up with. Its up to you to decide whether this solution is more elegant than the others or not 🙂
In general, the median calculation always varies depending on the number of items and whether this number is even or odd.
For an even population the median is the mean of the values in the middle:
the median of {3, 5, 7, 9} is is (5 + 7)/2 = 6
For an odd population, the median is the value in the middle:
the median of {3, 5, 9} is 5
In both cases the values have to be ordered before the calculation. Note that it does not make a difference whether the values are sorted in ascending or descending order.
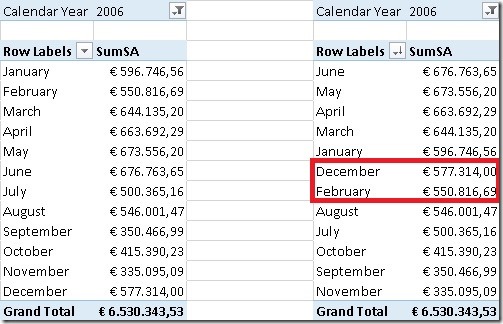
In this example, our set contains 12 items (=months) so we have to find the 2 items in the middle of the ordered set – December and February – and calculate the mean.
So, how can we address this problem using DAX? Most of the posts I mentioned above use some kind of combination of ranking – RANKX() – and filtering – FILTER(). For my approach I will use none of these but use TOPN instead (yes, I really like that function as you probably know if you followed my blog for some time).
In this special case, TOPN() can do both, ranking and filtering for us. But first of all we need to know how many items exist in our set:
This value will be subsequently used in our next calculations.
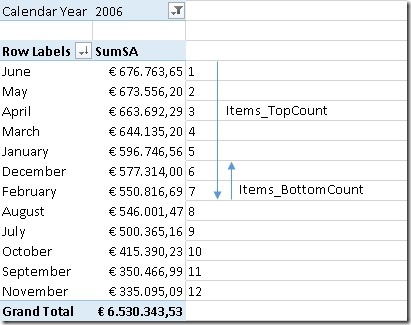
To find the value(s) in the middle I use TOPN() twice, first to get the first half of the items (similar to TopCount) and then a second time to get the last values that we need for our median calculation (similar to BottomCount):
As the median calculation is different for even and odd sets, this also has to be considered in our calculation. For both calculations MOD()-function is used to distinguish both cases:
([Cnt_Months] / 2) + 1,
([Cnt_Months] + 1) / 2)
For an even number of items (e.g. 12) we simply divide the count of items by 2 and add 1 which gives us a (12 / 2) + 1 = 7 for our sample.
For an odd number of items (e.g. 5) we first add 1 to our count of items and then divide by 2 which gives us (5 + 1) / 2 = 3
For an even number of items we have to consider the last 2 values whereas for an odd number of items we only have to consider the last value.
These calculations are then used in our median calculation:
TOPN(
[Items_BottomCount],
TOPN(
[Items_TopCount],
VALUES(‘Date’[Month]),
[SumSA]),
[SumSA] * -1))
/
[Items_BottomCount]
As DAX has no built-in BOTTOMN()-function, we need to “abuse” the TOPN() function and multiply the OrderBy-value by “–1” to get the BOTTOMN() functionality. As you can see most of the logic is already handled by our [Items_TopCount] and [Items_BottomCount] measures and this pattern can be reused very easily.
Of course all these calculations can also be combined and the use of IF() can be avoided:
TOPN(
2 – MOD([Cnt_Months], 2),
TOPN(
([Cnt_Months] + 1) / 2,
VALUES(‘Date’[Month]),
[SumSA]),
[SumSA] * -1))
/
(2 – MOD([Cnt_Months], 2))
Note: for an even population ([Cnt_Months] + 1) / 2 returns X.5 which is automatically rounded up when it is used in a function that expects a whole number. In our example this is what happens: (12 + 1) / 2 = 6.5 –> 7
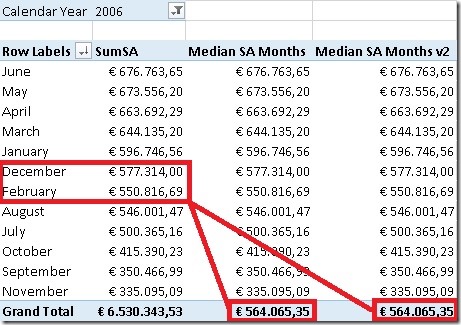
These are the final results:
Additional content:
We could also use AVERAGEX() to calculate our median but I think that it is some kind of overhead to use AVERAGEX() just to divide by “1” or “2” depending on the number of items that our TOPN-functions return:
TOPN(
2-MOD([Cnt_Months], 2),
TOPN(
([Cnt_Months] +1) / 2,
VALUES(‘Date’[Month]),
[SumSA]),
[SumSA] * -1),
[SumSA])
As you can see there are various approaches to calculate the median, its up to you which on you like most. I have not tested any of them in terms of performance over bigger sets – this may be topic for an upcoming post.
Download Final Model (Office 2013!)


Doesn’t the fourth parameter in TOPN() determine whether it performs a TOPN() or a BOTTOMN()?
well, thats true of course – thank you for the hint!
this woudl be the updated calculation:
Median SA Months:=CALCULATE([SumSA],
TOPN(
[Items_BottomCount],
TOPN(
[Items_TopCount],
VALUES(‘Date'[Month]),
[SumSA]),
[SumSA],
1))
/
[Items_BottomCount]
Interesting concept.
Would it be possible to create universal formula for percentiles (quartiles) 🙂
It seem that the biggest problem is interpolation between consecutive members.
it can be made dynamic/universal
I will show how in an upcoming post
What about this famous post ?? 🙂
The most elegant way to solve this in my opinion.
However, you have to be careful about ties, since TOPN can return more than 2 values.
An additional sort key (on ‘Date'[Month], for example) or an outer SAMPLE expression would be required for the calculation to return the correct results.
yes, you are absolutely right, TOPN may return any number of rows
I will update the post accordingly (and also the follow-up post)
Thanks for the hint
Great post. See David Hager’s post on how to solve the tie issue. It worked for me.
http://www.powerpivotpro.com/2011/07/guest-post-topn-in-powerpivot-v2/
This is working only for Time dimension, I have made solution working for other dimensions and aggregations:
Trick is to use Fact table ID, IF_FACT and SUMMARIZE(‘F_FACTS’;’F_FACTS'[ID_FACT];’F_FACTS'[M_MEASURE]);
Median from M_MEASURE:=CALCULATE(SUM([M_MEASURE]);
TOPN(
[Items_BottomCount];
TOPN(
[Items_TopCount];
SUMMARIZE(‘F_FACTS’;’F_FACTS'[ID_FACT];’F_FACTS'[M_MEASURE]);
[M_MEASURE]);
[M_MEASURE];
1)
)
/
[Items_BottomCount]
And this avoid duplicates of M_MEASURE:
Median from Measure:=CALCULATE(SUM([M_MEASURE]);
TOPN(
[Items_BottomCount];
TOPN(
[Items_TopCount];
SUMMARIZE(‘F_FACTS’;’F_FACTS'[ID_FACT];”tmp_M_MEASURE”;SUM(‘F_FACTS'[M_MEASURE]));
[tmp_M_MEASURE]);
[tmp_M_MEASURE];
1)
)
/
[Items_BottomCount]
Hi Kazo,
thanks for you feedback on this!
there are two issues I see with your solution:
1) using the colum from the fact-table gives different results
just assume you want to calculate the Median for a given year and current month is June
so you will only have 6 months in your fact-table whereas you will have 12 months in your time table and of course calculating the Median over 6 months returns very different results compared to 12 months
I would say this very much depens on the business-requirement, in general both calculations are valid
2) doing the Median on a column in your fact-table would require you to move this column to the fact-table (e.g. using RELATED()) which may result in an overhead in your facttable
and i would replace the SUMMARIZE() by a simple ADDCOLUMNS():
ADDCOLUMNS(VALUES(‘F_Facts'[ID_FACT]), “tmp_M_MEASURE”, [M_MEASURE])
also you do not have to use SUM() again if [M_MEASURES] already calculates the Sum over your fact-table
-gerhard
Hi Gerhard
I am a little new to DAX and also need a median function. I am not sure the solutions suggested here could work out for me. Can I have a median calculation for a cell (during pivottable browsing from excel) that would work similar to a sum or avg function (does not depend on another column but only to the filtered columns on the cell excluding blank values). This is for calculating medians in mortgage amount field, whichever selection the user made they want to have the median for that selection.
The function needs to handle empty/null ‘s and also many duplications in the amount (seems like TOPN function brings in the ties with it, there can be thousands of duplications in amount field for mortgages in US etc.)
Thank you
Hi Gokhan,
the Approach I described here calculates the median based on a given column and the aggregated amount of a measure
if I understood you correctly you Need this calculation to work for every column that you may pull into the Pivot-table?
this would only be possible if the calculation is done on the lowest grain/grain of the fact-table
is this what you Need?
-gerhard
Thank you for the solution to Median. Is it possible to display final median in all months’ rows. i.e. Jan thru December for all 12 rows – Median should be 564,035
this calculation will return the year-value for all months:
Median SA Year:=CALCULATE(
[Median SA Months v2],
ALL(‘Date'[Month]),
ALL(‘Date'[Month Name]))
does this work for you?
-gerhard
Thanks Gerhard for prompt reply. It works when there are no duplicates. But my data has lot of duplicates that needs to be taken into consideration.
What do you mean by duplicates?
The same value for two or more months?
this should not make any difference for your Median calculation
The issue I’m having is that when there’s a tie, it sums the total of the ties as the median value. For example: 1, 1, 2, 2, 3, 3, the median would be 4 instead of 2.
Maybe it’s because I replaced the Date VALUES with my entire table?
=CALCULATE([SumSA],
TOPN(
[Items_BottomCount],
TOPN(
[Items_TopCount],
VALUES(‘DATA’),
[SumSA]),
[SumSA] * -1))
/
[Items_BottomCount]]
yes, some people already reported issues with duplicate values
did you also check out the version at Daxpatterns.com?
http://www.daxpatterns.com/statistical-patterns/#median
if you are using Power BI you might also use the native MEDIAN function instead
kind regards,
-gerhard
I have a challenge hoping i can get some answers. I have a table with 3 columns and 4th column should be a calculated column based on the data in 3 columns.
SO Date PO Arr (calculated field)
123 2/1/2013 PO1 123
234 4/1/2013 PO1 123
345 5/1/2013 PO1 123
Arr = For the SO that has same PO #, Arr will be the earliest date of SO#
Could you please help me how to do this using DAX. Your help is greatlly appreciated. I will keep checking this webpage for any answers. Thanks again
hi, this should work
=CALCULATE(
VALUES(Table1[SO]),
TOPN(
1,
FILTER(ALL(Table1),
[PO] = EARLIER([PO])),
[Date])
)
though, I think there should also be a solution using FIRSTDATE() but I have not time at the moment 🙂
Gerhard,
Could I backtack to Gokhan’s email [August 11, 2013 at 19:07]? He was asking if he could have a ‘cell’ version of median, and you responded …only possible at the ‘lowest grain/grain’ of the fact-table…
Perhaps I could expand on that a bit?
I have a fact-table (totally denormalized) that has relative strength of stocks on the NYSE. It has fields for sector/industry/ticker and relative strength. In a very simple pivot table I would have a 3-tier hierarchy for row, relative strength as a value, and avg rel str for column. At the grain level, a ticker’s ‘avg rel str’ = the original rel str. At the industry level, the ‘avg rel str’ = the average of all rel str of the tickers in the industry. At the sector level, do as for industry but now for all the tickers of industries in the sector.
What you have for Median :, using TOPN counting months, would give the following:
1. ‘median rel str’ = original rel str at the ticker [grain level]? Yes?
2. ‘median industry rel str’ = ? at the industry level [1up from grain level]
3. ‘median sector rel str’ = ? at the sector level [2up from grain level]
Iff the hierarchy function could expand scope to ‘count the additional tickers’ [count the additional months]. That is how pivot tables gets the ‘average’ to expand scope I guess.
So I guess I am asking if that is doable? Or is that basically the reason ‘median’ is not part of basic pivot table ‘values’ options? And not part of dax?
Thanks, Ron
Hi Ron,
the main problem is that DAX is not very got at doing different calculations on different columns or handling hierarchies. Gokhans request was to make it dynamically so it works for all columns which is not really possible unless you define the calculation for every column separately.
In your case you only have 3 columns which are also in a hierarchy which makes the approach already described by Alberto Ferrari feasible:
http://www.sqlbi.com/articles/clever-hierarchy-handling-in-dax/
Check out the RatioToParent calculation at the end of the post. You would basically have to do the same:
1) use ISFILTERED() to find out on which level you are currently
2) adopt the calculation to use VALUES(
-gerhard
DAX itself is not aware of any hierarchies