Over the last year I worked a lot with Databricks on Azure and I have to say that I was (and still am) very impressed how well it works and how it integrates with other services of the Microsoft Azure Data Platform like Data Lake Store, Data Factory, etc.
Some of the projects I worked on also included CI/CD like pipelines using Azure DevOps where Databricks did not really shine so bright in the beginning. There are no native tasks for it or anything. But this is OK as for those scenarios, where you need to automate/script something, Databricks offers a REST API (Azure, AWS).
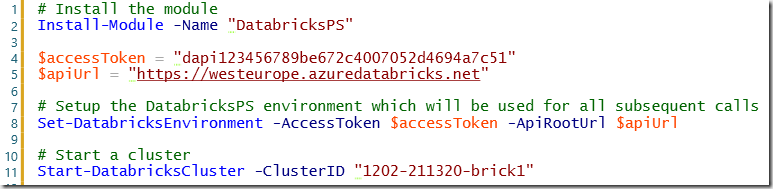
As most of our deployments use PowerShell I wrote some cmdlets to easily work with the Databricks API in my scripts. These included managing clusters (create, start, stop, …), deploying content/notebooks, adding secrets, executing jobs/notebooks, etc. After some time I ended up having 20+ single scripts which was not really maintainable any more. So I packed them into a PowerShell module and also published it to the PowerShell Gallery (https://www.powershellgallery.com/packages/DatabricksPS) for everyone to use!
The module works for Databricks on Azure and also if you run Databricks on AWS – fortunately the API endpoints are almost identical.
The usage is quite simple as for any other PowerShell module:
Install it using Install-Module cmdlet
Setup the Databricks environment using API key and endpoint URL
All the cmdlets are documented and contain links to official documentation of the Rest API call used by the cmdlet. Some API endpoints support different variations of parameters – this was implemented using different parameter sets in PowerShell. There are still some ongoing tests (especially on AWS) and improvements but I general all cmdlets work as expected. I hope this helps anyone else who also has to deal with the Databricks APIs frequently or has to integrate it in a CI/CD pipeline.
As some of you probably remember, when PowerPivot was still only available in Excel and Power Query did not yet exist, it was possible to load images from a database (binary column) directly into the data model and display them in PowerView. Unfortunately, this feature did not work anymore in PowerBI Desktop and the only way to display images in a visual was to provide the URL of the image which is public accessible. The visual would then grab the image on-the-fly from the URL and render it. This of course has various drawbacks:
The image needs to be available via a public URL (e.g. upload it first to an Azure Blob Store)
The image cannot be displayed when you are offline
The link may break in the future or point to a different image as initially when the model was built
Until today I was sure that we have to live with this limitation but then I came across this blog post from Jason Thomas aka SqlJason. He shows a workaround to store images directly in the PowerBI data model and display them in the report as if they were regular images loaded from an URL. This is pretty awesome and I have to dedicate at least 99.9% of this blog post to Jason and his solution!
However, with this blog post I would like to take Jasons’ approach a step further. He creates the Base64 string externally and hardcodes it in the model using DAX. This has some advantages (static image, no external dependency anymore, …) but also a lot of disadvantages (externally create the Base64 string, manually copy&paste the Base64 string for each image, hard to maintain, cannot dynamically add images …). For scenarios where you have a local folder with images, a set of [private] URLs pointing to images or images stored in a SQL table (as binary) which you want to load into your PowerBI data model, this whole process should be automated and ideally done within PowerBI.
Fortunately, this turns out to be quite simple! Power Query provides a native function to convert any binary to a Base64 encoded string: Binary.ToText() . The important part to point out here is to use the second parameter which allows you to set the encoding of the resulting text. It supports two values: BinaryEncoding.Base64 (default) and BinaryEncoding.Hex. Once we have the Base64 string, we simply need to prefix it with the following meta data: “data:image/jpeg;base64, “
To make it easy, I wrote to two custom PowerQuery functions which convert and URL or a binary image to the appropriate string which can be used by PowerBI:
let
    UrlToImage = (ImageUrl as text) as text =>
let
    BinaryContent = Web.Contents(ImageUrl),
    Base64 = "data:image/jpeg;base64, " & Binary.ToText(BinaryContent, BinaryEncoding.Base64)
in
    Base64
in
    UrlToImage
let
    BinaryToPbiImage = (BinaryContent as binary) as text=>
let
    Base64 = "data:image/jpeg;base64, " & Binary.ToText(BinaryContent, BinaryEncoding.Base64)
in
    Base64
in
    BinaryToPbiImage
If your images reside in a local folder, you can simply load them using the “Folder” data source. This will give you a list of all images and and their binary content as separate column. Next add a new Custom Column where you call the above function to convert the binary to a prefixed Base64 string which can then be displayed in PowerBI (or Analysis Services) as a regular image. Just make sure to also set the Data Category of the column to “Image URL”:
And that’s it, now your visual will display the image stored in the data model without having to access any external resources!
Caution: As Jason also mentions at the end of his blog post, there is an internal limitation about the size of a text column. So this may cause issues when you try to load high-resolution images! In this case, simply lower the size/quality of the images before you load them. UPDATE May 2019: Chris Webb provides much more information and a solution(!) to this issue in his blog post: https://blog.crossjoin.co.uk/2019/05/19/storing-large-images-in-power-bi-datasets
Download:StoreImageInPbiModel.pbix This PowerBI Desktop model contains all samples from above including the PowerQuery functions!
As you probably know from my last blog post, I am currently upgrading the PowerBI reporting platform of one of my customer from a PowerBI backend (dataset hosted in PowerBI service) to an Azure Analysis Services backend. The upgrade/import of the dataset into Azure Analysis Services itself worked pretty flawless and after switching the connection of the reports everything worked as expected and everyone was happy. However, things got a bit tricky when it came to automatically refreshing the Azure Analysis Services database which was based on an Azure Data Lake Store. For the original PowerBI dataset, this was pretty straight forward as a scheduled refresh from an Azure Data Lake store data source works out of the box. For Azure Analysis Services this is a bit different.
When you build and deploy your data model from Visual Studio, your are prompted for the credentials to access ADLS which are then stored in the data source object of AAS. As you probably know, AAS uses OAuth authentication to access data from ADLS. And this also causes a lot of problems. OAuth is based on tokens and those tokens are only valid for a limited time, by default this is 2 hours. This basically means, that you can process your database for the next 2 hours and it will fail later on with an error message saying that the token expired. (The above applies to all OAuth sources!)
This problem is usually solved by using an Azure Service Principal instead of a regular user account where the token does not expire. Unfortunately, this is not supported at the moment for ADLS data sources and you have to work around this issue.
IMPORTANT NOTE: NONE OF THE FOLLOWING IS OFFICIALLY SUPPORTED BY MICROSOFT !!!
So the current situation that we need to solve is as follows:
we can only use regular user accounts to connect AAS to ADLS as service principals are not supported yet
the token expires after 2 hours
the database has to be processed on a regular basis (daily, hourly, …) without any manual interaction
manually updating the token is (of course) not an option
Back to our example – as we were already using Azure Automation for some other tasks, we decided to also use it here. Also, PowerShell integrates very well with other Azure components and was the language of choice for us. To accomplish our goal we had to implement 3 steps:
acquire a new OAuth token
update the ADLS data source with the new token
run our processing script
I could copy the code for the first step more or less from one of my older blog post (here) where I used PowerShell to acquire an OAuth token to trigger a refresh in PowerBI.
The second step is to update ADLS data source of our Azure Analysis Services model. To get started, the easiest thing to do is to simply open the AAS database in SQL Server Management Studio and let it script the existing datasource for you:
The resulting JSON will look similar to this one:
The important part for us is the “credential” field. It contains all the information necessary to authenticate against our ADLS store. However, most of this information is sensitive so only asterisks are displayed in the script. The rest of the JSON (except for the “credential” field) is currently hardcoded in the PowerShell cmdlet so if you want to use it, you need to change this manually!
The PowerShell cmdlet then combines the hardcoded part with an updated “credential”-field which is obtained by invoking a REST request to retrieve a new OAuth token. The returned object is modified a bit in order to match the required JSON for the datasource.
Once we have our final JSON created, we can send it to our Azure Analysis Services instance by calling the Invoke-ASCmd cmdlet from the SqlServer module.
Again, please see the original blog post mentioned above for the details of this approach.
After we have updated our datasource, we can simply call our regular processing commands which will then be executed using the newly updated credentials.
The script I wrote allows you to specify which objects to process in different ways:
whole database (by leaving AASTableName and AASPartitionName empty)
a single or multiple table and all its partitions (by leaving only AASPartitionName empty)
or multiple partitions of a single table (by specifying exactly one AASTableName and multiple AASPartitionNames
If multiple tables or partitions are specified, the elements are separated by commas (“,”)
So to make the Runbook work in your environment, follow all the initial steps as described in the original blog post from Microsoft. In addition, you also need to create an Application (Type = “Native”) in your Azure Active Directory to obtain the OAuth token programmatically. This application needs the “Sign in and read user profile” permission from the API “Windows Azure Active Directory (Microsoft.Azure.ActiveDirectory)”:
Also remember the ApplicationID, it will be used as a parameter for the final PowerShell Runbook (=parameter “ClientID”!
When it comes to writing the PowerShell code, simply use the code from the download at the end of this blog post.
For the actual credential that you are using, make sure that it has the following permissions:
to update the AAS datasource (can be set in the AAS model or for the whole server)
has access to the required ADLS files/folders which are processed (can be set e.g. via ADLS Data Explorer)
(if you previously used your own account to do all the AAS and ADLS development, this should work just fine)
In general, a similar approach should work for all kinds of datasources that require OAuth authentication but so far I have only tested it with Azure Data Lake Store!
In June 2017, Microsoft announced a new set of API function to manage data refreshes in PowerBI. The new API basically allows you to trigger a refresh or retrieve the history of previously executed refreshes. The full specification can be found in the official MSDN documentation, or using this direct links: Refresh dataset and Get dataset refresh history
So besides the scheduled and manual refreshes from within the PowerBI service directly, we now have a third option to trigger refreshes but this time also from an external caller! This itself is already pretty awesome and some people already did some cool stuff leveraging the new API functions:
The basic idea is to use object from pre-built Azure Management DLLs to generate the OAuth Access token that is necessary to use the API. This works very well locally but cannot be used in the cloud – e.g. in combination with Azure Automation Runbooks or Azure Functions where you cannot install or reference any custom DLLs.
In this blog post I will show you how you can accomplish exactly this – create an Azure Automation Runbook to refresh your PowerBI dataset! But first of all there are some things that you need to keep in mind:
There are no service accounts in PowerBI so we will always use a “real” user
you need to supply the credentials of a “real” user
The user needs to have appropriate access to the dataset in order to refresh it
the dataset refresh must succeed if you do it manually in PowerBI
you are still limited to 8 refreshes/day through the API
OK, so lets get started. First of all we need an Azure Application which has permissions in PowerBI. The easiest way to do this is to use the navigate to https://dev.powerbi.com/apps, log in with your account and simply follow the steps on the screen. The only import thing is to select the App Type “Native app”. At the end, you will receive a ClientID and a ClientSecret – Please remember the ClientID for later use!
Now lets take a look at the PowerShell code. Instead of using any pre-built DLLs I removed all unnecessary code and do all the communication using Invoke-RestMethod. This is a very low-level function and is part of the standard PowerShell modules so there is no need to install anything! The tricky part is to acquire an Authentication Token using username/password as it is nowhere documented (at least I could not find it) what the REST call has to look like. So I used Fiddler to track the REST calls that the pre-built DLLs use and rebuilt them using Invoke-RestMethod. This is what I came up with:
$clientId is the ClientID of the Azure AD Application $pbiUsername is the email address of the PowerBI user. $pbiPassword is the password of the PowerBI user. The $authRepsonse then contains our Authentication token which we can use to make our subsequent calls:
And that’s all you need. I wrapped everything into a PowerShell function that can be used as an Azure Runbook. The username/password is derived from an Azure Automation Credential.
CredentialName – the name of the Azure Automation credential that you created and which stores the PowerBI username and password
ClientID – the ID of your Azure Active Directory Application which you created in the first step
PBIDatasetName – the name of the PowerBI dataset that you want to refresh
PBIGroupName – (optional) the name of the group/workspace in which the PowerBI dataset from 3) resides
When everything is working as expected, you can create custom schedules or even create webhooks to trigger the script and refresh you PowerBI dataset! As you probably know, this is really powerful as you can now make the refresh of the PowerBI dataset part of your daily ETL job!
Some time ago, when Microsoft released the first version of Power BI Rest API I already wrote a wrapper for C# which allowed you to map the object from the API into regular C# objects and work with them locally. However, there have been some major upgrades since then (Actually they were already announced in July 2016 but I did not find anytime to work on this again until now ). Anyway, I just published a new version of my C# wrapper on my GitHub site: https://github.com/gbrueckl/PowerBI.API.Client
To use it, you first need to create an Azure AD application and get an ApplicationID – this is very well described here or can be done directly at https://dev.powerbi.com/apps
A new PowerBI API Client object can then be created using the ApplicationID:
Basically, most of the features described in the API reference are also included in the API Wrapper. So you can now use C# to create your PowerBI model locally and deploy it to the PowerBI service! The only to keep in mind is that the dataset you create via the API can only be sourced by pushing data into it using the Push/Streaming API. As this can be quite cumbersome sometimes, I also added the functionality to publish a whole C# DataTable with basically just two lines of code to publish your reference data/dimensions:
Publish DataTable to PowerBI
// create a regular DataTable – but could also be derived from a SQL Database! DataTable dataTable = newDataTable(); /* populate the dataTable */ // create a PBI table from a regular DataTable object PBITable productsTable = newPBITable(dataTable); // publish the table and push the rows from the dataTable to the PowerBI table productsTable.PublishToPowerBI(true);
This snippet basically deploys the table structure to the PowerBI service and populates it with data from the DataTable:
For your “fact”-data you can also create single rows on your own using the PBIRow-object and publish them manually e.g. for WriteBack-scenarios:
Of course, all the features that were already supported in the first version, are still supported:
Get Embed-URLs of Reports and Tiles
List Reports, Dashboards, Datasets, …
The new version also supports Streaming and PushStreaming datasets in the same way as it does for regular Push datasets. For details on Streaming datasets please take a look at Real-time streaming in PowerBI
I recommend to explore the API on your own by simply building your first PowerBI Push/Streaming Model on your own! For the latest features and improvements please refer to the GitHub repository which will be updated frequently.
Any feedback and participation in the further development is highly appreciated and will be done via the GitHub repository.
In my last post I wrote about how to Debug Custom .Net Activities in Azure Data Factory locally. This fixes one of the biggest issues in Azure Data Factory at the moment for developers. The next bigger problem that you will run into is when it comes to deploying your Azure Data Factory project. At the moment, you can only do it manually from Visual Studio which, for bigger projects, can take quite some time. So I extended and advanced the code from my CustomActivityDebugger. Well, actually I rewrote some major parts of it and moved it into a new GitHub repository: Azure.DataFactory.LocalEnvironment
The new code base now includes the functionality to export an existing ADF project to an ARM template which can then be deployed very easily using Azure standard deployment mechanisms.
So basically, these are the changes and new Features that I made:
Export as ARM template:
Export all ADF objects and properties
Support for configurations
obey dependencies between ADF objects
parameterized Data Factory name
automatic upload of ADF dependencies (e.g. custom activities)
specify the region where ADF should be deployed (ADF is not available in all regions yet!)
Custom Activity Debugger:
simplified usability – just select the pipeline, activity and set the slice-dates
Support for configurations
no need to add any namespaces
no need to add any references
write activity log to console output
General:
Load from the ADF Project file (.dfproj) instead of a whole folder
implemented as Assembly
can be used in a Console Application for automation
will be published via NuGet in the future! (coming soon)
Everything else is described in the Git-Repository itself!
One of the most requested features when it comes to Azure ML is and has always been the integration into PowerBI. By now we are still lacking a native connector in PowerBI which would allow us to query a published Azure ML web service directly and score our datasets. Reason enough for me to dig into this issue and create some Power Query M scripts to do this. But lets first start off with the basics of Azure ML Web Services.
Every Azure ML project can be published as a Web Service with just a single click. Once its published, it can be used like any other Web Service. Usually we would send a record or a whole dataset to the Web Service, the Azure ML models does some scoring (or any other operation within Azure ML) and then sends the scored result back to the client. This is straight forward and Microsoft even supplies samples for the most common programming languages. The Web Service relies on a standardized REST API which can basically be called by any client. Yes, in our case this client will be PowerBI using Power Query. Rui Quintino has already written an article on AzureML Web Service Scoring with Excel and Power Query and also Chris Webb wrote a more generic one on POST Request in Power Query in general Web Service and POST requests in Power Query. Even Microsoft recently published an article how you can use the R Integration of Power Query to call a Azure ML Web Service here.
Having tried these solutions, I have to admit that they have some major issues: 1) very static / hard coded 2) complex to write 3) operate on row-by-row basis and might run into the API Call Limits as discussed here. 4) need a local R installation
As Azure ML usually deal with tables, which are basically Power Query DataSets, a requirement would be to directly use a Power Query DataSet. The DataSet has to be converted dynamically into the required JSON structure to be POSTed to Azure ML. The returned result, usually a table again, should be converted back to a Power Query DataSet. And that’s what I did, I wrote a function that does all this for you. All information that you have to supply can be found in the configuration of your Azure ML Web Service: – Request URI of your Web Service – API Key – the [Table to Score]
the [Table to Score] can be any Power Query table but of course has to have the very same structure (including column names and data types) as expected by the Web Service Input. Then you can simply call my function:
The whole process involves a lot of JSON conversions and is kind of complex but as I encapsulated everything into M functions it should be quite easy to use by simply calling the CallAzureMLService-function.
However, here is a little description of the used functions and the actual code:
ToAzureMLJson – converts any object that is passed in as an argument to a JSON element. If you pass in a table, it is converted to a JSON-array. Dates and Numbers are formatted correctly, etc. so the result can the be passed directly to Azure ML.
let
    ToAzureMLJson= (input as any) as text =>
let
    transformationList = {
        [Type = type time, Transformation = (value_in as time) as text => """" & Time.ToText(value_in, "hh:mm:ss.sss") & """"],
        [Type = type date, Transformation = (value_in as date) as text => """" & Date.ToText(value_in, "yyyy-MM-dd") & """"],
        [Type = type datetime, Transformation = (value_in as datetime) as text => """" & DateTime.ToText(value_in, "yyyy-MM-ddThh:mm:ss.sss" & """")],
        [Type = type datetimezone, Transformation = (value_in as datetimezone) as text => """" & DateTimeZone.ToText(value_in, "yyyy-MM-ddThh:mm:ss.sss") & """"],
        [Type = type duration, Transformation = (value_in as duration) as text => ToAzureMLJson(Duration.TotalSeconds(value_in))],

        [Type = type number, Transformation = (value_in as number) as text => Number.ToText(value_in, "G", "en-US")],
        [Type = type logical, Transformation = (value_in as logical) as text => Logical.ToText(value_in)],

        [Type = type text, Transformation = (value_in as text) as text => """" & value_in & """"],

        [Type = type record, Transformation = (value_in as record) as text =>
                            let
                                GetFields = Record.FieldNames(value_in),
                                FieldsAsTable = Table.FromList(GetFields, Splitter.SplitByNothing(), {"FieldName"}, null, ExtraValues.Error),
                                AddFieldValue = Table.AddColumn(FieldsAsTable, "FieldValue", each Record.Field(value_in, [FieldName])),
                                AddJson = Table.AddColumn(AddFieldValue, "__JSON", each ToAzureMLJson([FieldValue])),

                                jsonOutput = "[" & Text.Combine(AddJson[__JSON], ",") & "]"
                            in
                                jsonOutput
                            ],
        [Type = type table, Transformation = (value_in as table) as text =>
                            let
                                BufferedInput = Table.Buffer(value_in),
                                GetColumnNames = Table.ColumnNames(BufferedInput),
                                ColumnNamesAsTable = Table.FromList(GetColumnNames , Splitter.SplitByNothing(), {"FieldName"}, null, ExtraValues.Error),
                                ColumnNamesJson = """ColumnNames"": [""" & Text.Combine(ColumnNamesAsTable[FieldName], """, """) & """]",

                                AddJson = Table.AddColumn(value_in, "__JSON", each ToAzureMLJson(_)),
                                ValuesJson = """Values"": [" & Text.Combine(AddJson[__JSON], ",#(lf)") & "]",

                                jsonOutput = "{""Inputs"": { ""input1"": {" & ColumnNamesJson & "," & ValuesJson & "} }, ""GlobalParameters"": {} }"
                            in
                                jsonOutput
                            ],
        [Type = type list, Transformation = (value_in as list) as text => ToAzureMLJson(Table.FromList(value_in, Splitter.SplitByNothing(), {"ListValue"}, null, ExtraValues.Error))],

        [Type = type binary, Transformation = (value_in as binary) as text => """0x" & Binary.ToText(value_in, 1) & """"],


        [Type = type any, Transformation = (value_in as any) as text => if value_in = null then "null" else """" & value_in & """"]

    },

    transformation = List.First(List.Select(transformationList , each Value.Is(input, _[Type]) or _[Type] = type any))[Transformation],

    result = transformation(input)
in
    result
in
    ToAzureMLJson
AzureMLJsonToTable – converts the returned JSON back to a Power Query Table. It obeys column names and also data types as defined in the Azure ML Web Service output. If the output changes (e.g. new columns are added) this will be taken care of dynamically!
let
    AzureMLJsonToTable = (azureMLResponse as binary) as any =>
let
    WebResponseJson = Json.Document(azureMLResponse ,1252),
    Results = WebResponseJson[Results],
    output1 = Results[output1],
    value = output1[value],
    BufferedValues = Table.Buffer(Table.FromRows(value[Values])),
    ColumnNameTable = Table.AddIndexColumn(Table.FromList(value[ColumnNames], Splitter.SplitByNothing(), {"NewColumnName"}, null, ExtraValues.Error), "Index", 0, 1),
    ColumnNameTable_Values = Table.AddIndexColumn(Table.FromList(Table.ColumnNames(BufferedValues), null, {"ColumnName"}), "Index", 0, 1),

    RenameList = Table.ToRows(Table.RemoveColumns(Table.Join(ColumnNameTable_Values, "Index", ColumnNameTable, "Index"),{"Index"})),
    RenamedValues = Table.RenameColumns(BufferedValues, RenameList),

    ColumnTypeTextTable = Table.AddIndexColumn(Table.FromList(value[ColumnTypes], Splitter.SplitByNothing(), {"NewColumnType_Text"}, null, ExtraValues.Error), "Index", 0, 1),
    ColumnTypeText2Table = Table.AddColumn(ColumnTypeTextTable, "NewColumnType", each
     if Text.Contains([NewColumnType_Text], "Int") then type number
else if Text.Contains([NewColumnType_Text], "DateTime") then type datetime
else if [NewColumnType_Text] = "String" then type text
else if [NewColumnType_Text] = "Boolean" then type logical
else if [NewColumnType_Text] = "Double" or [NewColumnType_Text] = "Single" then type number
else if [NewColumnType_Text] = "datetime" then type datetime
else if [NewColumnType_Text] = "DateTimeOffset" then type datetimezone
else type any),
    ColumnTypeTable  = Table.RemoveColumns(ColumnTypeText2Table ,{"NewColumnType_Text"}),

    DatatypeList = Table.ToRows(Table.RemoveColumns(Table.Join(ColumnNameTable, "Index", ColumnTypeTable, "Index"),{"Index"})),
    RetypedValues = Table.TransformColumnTypes(RenamedValues, DatatypeList, "en-US"),

    output = RetypedValues
in
    output
in
    AzureMLJsonToTable
CallAzureMLService – uses the two function from above to convert a table to JSON, POST the JSON to Azure ML and convert the result back to a Power Query Table.
let
    CallAzureMLService = (
        WebServiceURI as text,
        WebServiceKey as text,
        TableToScore as table,
        optional Timeout as number
    ) as any =>
let
    WebTimeout = if Timeout = null then #duration(0,0,0,100) else #duration(0,0,0,Timeout) ,

    WebServiceContent = ToAzureMLJson(TableToScore),

    WebResponse = Web.Contents(WebServiceURI,
        [Content = Text.ToBinary(WebServiceContent),
         Headers = [Authorization="Bearer " & WebServiceKey,
                    #"Content-Type"="application/json",
                    Accept="application/json"],
         Timeout = WebTimeout]),

    output = AzureMLJsonToTable(WebResponse)
in
    output
in
    CallAzureMLService
Known Issues: As the [Table to Score] will probably come from a SQL DB or somewhere else, you may run into issues with Privacy Levels/Settings and the Formula Firewall. In this case make sure to enable Fast Combine for your workbook as described here.
The maximum timeout of a Request/Response call to an Azure ML Web Service is 100 seconds. If your call exceeds this limit, you might get an error message returned.I ran a test and tried to score 60k rows (with 2 numeric columns) at once and it worked just fine, but I would assume that you can run into some Azure ML limits here very easily with bigger data sets. As far as I know, these 100 seconds are for the Azure ML itself only. If it takes several minutes to upload your dataset in the POST request, than this is not part of this 100 seconds. If you are still hitting this issue, you could further try to split your table into different batches, score them separately and combine the results again afterwards.
So these are the steps that you need to do in order to use your Azure ML Web Service together with PowerBI: 1) Create an Azure ML Experiment (or use an existing) 2) Publish the Experiment as a Web Service 3) note the URL and the API Key of your Web Service 4) run PowerBI and load the data that you want to score 5) make sure that the dataset created in 4) has the exact same structure as expected by Azure ML (column names, data types, …) 6) call the function “CallAzureMLWebService” with the parameters from 3) and 5) 7) wait for the Web Service to return the result set 8) load the final table into PowerBI (or do some further transformations before)
And that’s it!
Download: You can find a PowerBI workbook which contains all the functions and code here: CallAzureMLWebService.pbix I used a simple Web Service which takes 2 numeric columns (“Number1” and “Number2”) and returns the [Number1] * [Number2] and [Number1] / [Number2]
PS: you will not be able to run the sample as it is as I changed the API Key and also the URL of my original Azure ML Web Service
One of the coolest features of Power BI is that I integrates very well with other tools and also offers a lot of interfaces which can be used to extend this capabilities even further. One of those is the R Integration which allows you to run R code from within Power BI. R scripts can either be used as a data source or for visualizing your data. In this post I will focus on the data source component and show how you can use a locally stored R script and execute it directly in Power BI. Compared to the native approach where you need to embed the R code in the Power BI file, this has several advantages:
Develop R script in familiar external tool like RStudio
Integration with Source Control
Leverage Power BI for publishing and visualizing results
Out of the box Power BI only supplies one function to call R scripts as a data source which is R.Execute(text). Usually, when you use the wizard, it simply passes your R script as a hardcoded value to this function. Knowing the power of Power BI and its scripting language M for data integration made me think – “Hey, as R scripts are just text files and Power BI can read text files, I could also dynamically read any R script and execute it!”
Well, turns out to be true! So I created a little M function where I pass in the file-path of an existing R script and which returns a table of data frames which are created during the execution of the script. Those can then be used like any other data sets/tables within Power BI:
And here is the corresponding M code for the Power Query function: (Thanks also to Imke Feldmann for simplifying my original code to the readable one below)
let
LoadLocalRScript = (file_path as text) as table =>
First we read the R script like any other regular CSV file but we use line-feed (“#(lf)”) as delimiter. So we get a table with one column and one row for each line of our original R script. Then we use Text.Combine() on our column to transform the single lines back into one long text resembling our original R script. This text can the be passed to the R.Execute() function to return the list of R data frames created during the execution of the script.
And that’s it! Any further steps are similar to using any regular R script which is embedded in Power BI so it is up to you on how you proceed from here. Just one thing you need to keep in mind is that changing the local R script might break the Power BI load if you changed or deleted any data frames which are referenced in Power BI later on.
One issues that I came across during my tests is that this approach does not work with scheduled refreshes in the Power BI Web Service via the Personal Gateway. The first reason for this is that it is currently not possible to use scheduled refresh if custom functions are involved. Even if you can work around this issue pretty easily by using the code from above directly in Power Query I still ran into issues with different privacy levels for the location of the R script and the R.Execute() function. But I will investigate into those issues and update this blog post accordingly (see UPDATE below). For the future I hope that is fixed by Microsoft and Power BI allows you to execute remote scripts natively – but until then, this approach worked quite well for me.
UPDATE: To make the refresh via the Personal Gateway work you have to enable “FastCombine”. How to do this is described in more detail here: Turn on FastCombine for Personal Gateway.
In case you are interested in more details on this approach, I am speaking at TugaIT in Lisbon, Portugal this Friday (20th of May 2016) about “Power BI for the Data Scientist” where I will cover this and lots of other interesting topics about the daily work of a data scientist and how PowerBI can used to ease them.
UPDATE: This does not work for Tabular Models in Compatibility Level 120 or above as they do not expose the calculation dependencies anymore!
One of my best practices when designing bigger SQL Server Analysis Services (SSAS) Tabular models is to nest calculations whenever possible. The reasons for this should be quite obvious:
no duplication of logics
easier to develop and maintain
(caching)
However, this also comes with a slight drawback: after having created multiple layers of nested calculations it can be quite hart to tell on which measures a top-level calculations actually depends on. Fortunately the SSAS engine exposes this calculation dependencies in one of its DMVs – DISCOVER_CALC_DEPENDENCY. This DMV basically contains information about all calculations in the model:
Calculated Measures
Calculated Columns
Relationships
Dependencies to Tables/Columns
Chris Webb already blogged about this DMV some time ago and showed some basic (tabular) visualization within an Excel Pivot table (here). My post focuses on PowerBI and how can make the content of this DMV much more appealing and visualize it in a way that is very easy to understand. As the DMV is built up like a parent-child hierarchy, I had to use a recursive M-function to resolve this self-referencing table which actually was the hardest part to do. Each row contains a link to a dependent object, which can have other dependencies again. In order to visualize this properly and let the user select a Calculation of his choice to see a calculation tree, I needed to expand each row with all of its dependencies, keeping their link to the root-node:
Here is a little example:
Object
Referenced_Object
A
B
B
C
The table above is resolved to this table:
Root
Object
Referenced_Object
A
A
B
A
B
C
B
B
C
The Root-column is then used to filter and get all dependent calculations. The PowerBI file also contains some other M-functions but those are mainly for ease-of-use and to keep the queries simple.
You can use the Slicers to filter on the Table, the Calculation Type and the Calculation itself and the visual shows all the dependencies down to the physical objects being Tables and Columns. This makes it a lot easier to understand your model and the dependencies that you built up over time. I attached the sample-PowerBI-file below. You simply need to change the connectionstring to your SSAS Tabular Server and refresh the data connections.
Since the last major update last year, Power BI offers some APIs which can be used to interact with content and also data that is stored in Power BI. Microsoft provides a good set of samples on how to use the APIs on GitHub and also a an interactive APIARY web-UI which you can use to build and test API calls on-the-fly. However, it can still be quite cumbersome as you have to deal with all the REST API calls and the returned JSON on your own. So I decided to write a little C# Wrapper where you simply pass in your Azure AD Application Client ID and you can deal with all Object of the Power BI API as they were regular C# objects.
Here is a little example on how to list all available reports and get the EmbedURL of a given tile using the PowerBIClient:
using System; using System.Collections.Generic; using System.Linq; using System.Text; using System.Threading.Tasks; using pmOne.PowerBI; using pmOne.PowerBI.PowerBIObjects;
Console.WriteLine(“Press <Enter> to exit …”); Console.ReadLine(); } } }
As you can see, its pretty simple and very easy to use, even for non-developers. You can find all the source-code and the sample application for download below. The code as I have written it is very likely not the best code possible, but it works for my needs, is straight forward, simple and saves me a lot of work and time when dealing with the PowerBI API. Also, if the API changes, you may need to adopt the code accordingly. However, for the future I hope that Microsoft provides some metadata so that VisualStudio can build all this code automatically using e.g. Swagger. But for the time being feel free to use, improve or extend my code