Some time ago Microsoft released the first preview of a tool which allows you to monitor and control your Azure Data Factory (ADF). It is a web UI where you can select your Pipeline, Activity or Dataset and check its execution state over time. However, from my very personal point of view the UI could be much better, especially much clearer(!) as it is at the moment. But that’s not really a problem as the thing I like the most about ADF is that its quite open for developers (for example Custom C#/.Net Activities) and it also offers a quite comprehensive REST API to control an manage it.
For our monitoring purposes we are mainly interested in the LIST interface but we could do basically every operation using this API. In my example I only used the Dataset API, the Slices API and the Pipeline API.
First we start with the Dataset API to get a list of all data sets in our Data Factory. This is quite simple as we just need to build our URL of the REST web service like this:
- https://management.azure.com/subscriptions/{SubscriptionID}/resourcegroups/{ResourceGroupName}/providers/Microsoft.DataFactory/datafactories/{DataFactoryName}/datasets?api-version={api-version}
You can get all of this information for the Azure Portal by simply navigating to your Data Factory and checking the URL which will be similar to this one:
- https://portal.azure.com/#resource/subscriptions/12345678–3232–4a04–a0a6–6e44bf2f5d11/resourceGroups/myResourceGroup/providers/Microsoft.DataFactory/dataFactories/myDataFactory
So this would be my values for the API Call:
– {SubscriptionID} would be “12345678-3232-4a04-a0a6-6e44bf2f5d11”
– {ResourceGroupName} would be “myResourceGroup”
– {DataFactoryName} would be “myDataFactory”
– {api-version} would be a fixed value of “2015-10-01”
Once you have your URL you can use PowerBI to query the API using Get Data –> From Web
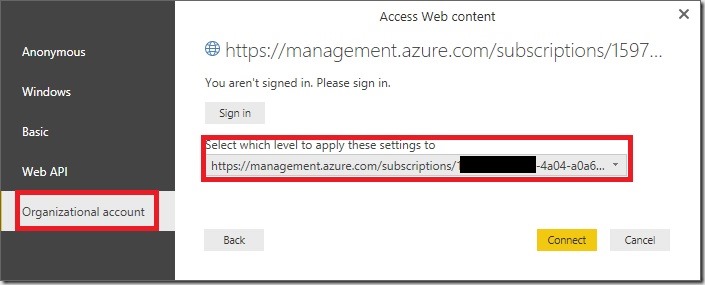
Next you need to authenticate using your Personal or Organizational Account – the same that you use to sign in to the Portal – and also the level for which you want to use the credentials. I’d recommend you to set it either to the subscription level or to the data-factory itself, depending on your security requirements. This ensures that you are not asked for credentials for each different API:
This works in a very similar way also for the Slices API, the Pipeline API and all other APIs available! The other transformations I used are regular PowerQuery/M steps done via the UI so I am not going to describe them in more detail here. Also, setting up the relationships in our final PowerPivot model should be straight forward.
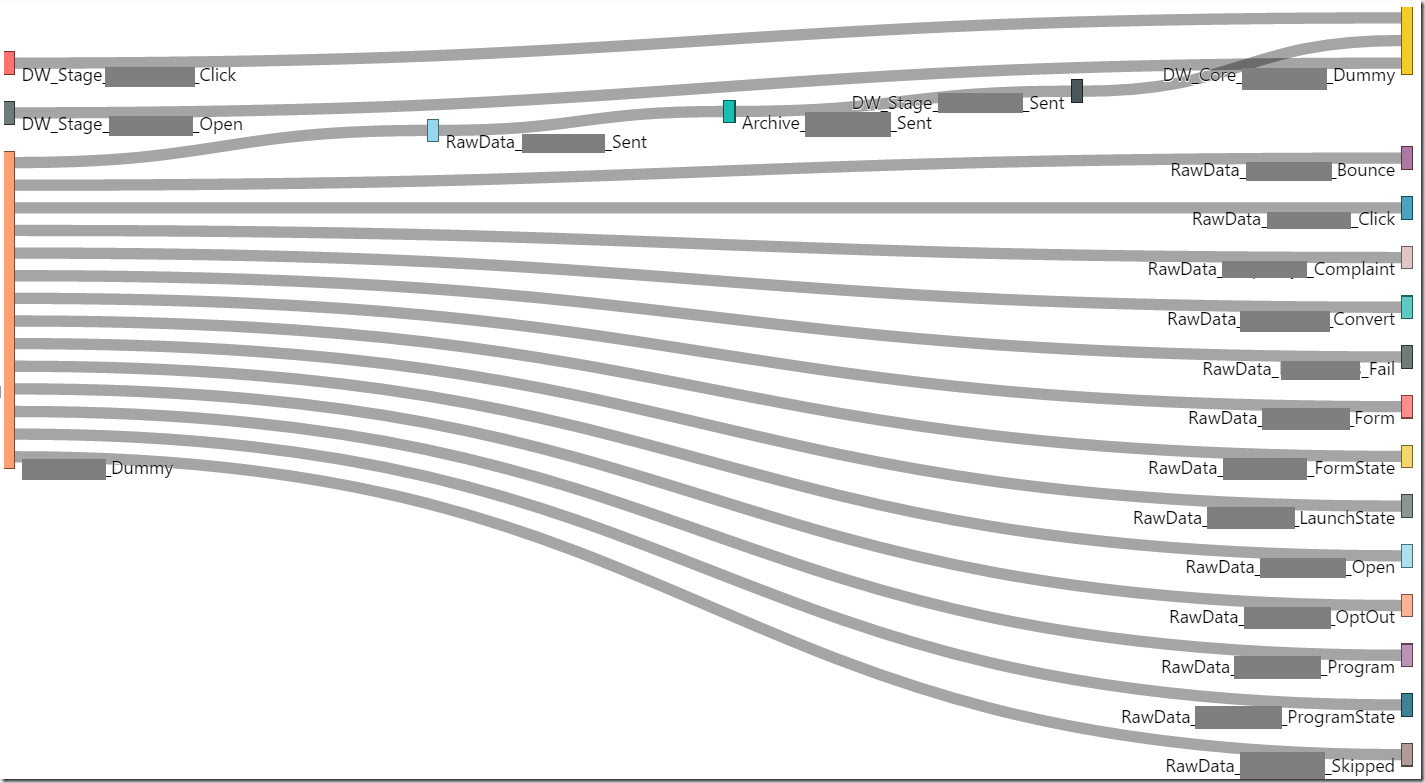
Now that we have all the required data in place, we can start with our report. I used some custom visuals for the calendar view, some slicers and a simple table to show the details. I also used a Sankey Chart to visualize the dependencies between the datasets.
Compared to the standard GUI for monitoring this provides a much better overview of slices and their current states and it also allows easy filtering. I am sure there are a lot of other PowerBI visualizations which would make a lot of sense here, these are just to give you an idea how it could look like, but of course you have all the freedom PowerBI offers you for reporting!
The only drawback at the moment is that you cannot reschedule/reset slices from PowerBI but for my monitoring-use-case this was not a problem at all. Also, I did not include the SliceRun API in my report as this would increase the size of the data model a lot, so detailed log information is not available in my sample report.
The whole PowerBI template is available for download on my GitHub site: https://github.com/gbrueckl/Azure.DataFactory.PowerBIMonitor

