Dynamic ABC Analysis in PowerPivot using DAX

An ABC Analysis is a very common requirement for for business users. It classifies e.g. Items, Products or Customers into groups based on their sales and how much impact they had on the cumulated overall sales. This is done in several steps.

I just published a new version of the Dynamic ABC Analysis at www.daxpatterns.com. The article can be found here.


1) Order products by their sales in descending order
2) Cumulate the sales beginning with the best selling product till the current product
3) Calculate the percentage of the cumulated sales vs. total sales
4) Assign a Class according to the cumulated percentage

Marco Russo already blogged about this here. He does the classification in a calculated column based on the overall sales of each product. As calculated columns are processed when the data is loaded, this is not dynamic in terms of your filters that you may apply in the final report. If, for example, a customer was within Class A regarding total sales but had no sales last year then a report for last year that uses this classification may give you misleading results.

In this blog I will show how to do this kind of calculation on-the-fly always in the context of the current filters. I am using Adventure Works DW 2008 R2 (download) as my sample data and create a dynamic ABC analysis of the products.

The first thing we notice is that our product table is a slowly changing dimension of type 2 and there are several entries for the same product as every change is traced in the same table.

SCD2Table

So we want to do our classification on the ProductAlternateKey (=Business Key) column instead of our ProductKey (=Surrogate Key) column.

First we have to create a ranking of our products:

Rank CurrentProducts:=IF(HASONEVALUE(DimProduct[ProductAlternateKey]),
IF(NOT(ISBLANK([SUM SA])),
RANKX(
CALCULATETABLE(
VALUES(DimProduct[ProductAlternateKey]),
ALL(DimProduct[ProductAlternateKey])),
[SUM SA])))

Check if there is only one product in the current context and that this product also has sales. If this is the case we calculate our rank. We need to do the CALCULATETABLE to do the ranking within the currently applied filters on other columns of the DimProduct-table e.g. if a filter is applied to DimProduct[ProductSubcategoryKey] we want to see our ranking within that selected Subcategory and not against all Products.

I also created a measure [SUM SA] just to simplify the following expressions:

SUM SA:=SUM(FactInternetSales[SalesAmount])


The second step is to create a running total starting with the best-selling product/the product with the lowest rank:

CumSA CurrentProducts:=SUMX(
TOPN(
[Rank CurrentProducts],
CALCULATETABLE(
VALUES(DimProduct[ProductAlternateKey]),
ALL(DimProduct[ProductAlternateKey])),
[SUM SA]),
[SUM SA])

We use a combination of SUMX() and TOPN() here. TOPN() returns the top products ordered by [SUM SA]. Further we use our previously calculated rank to only get the products that have the same or more sales than the current product. For example if the current product has rank 3 we sum up the top 3 products to get our cumulated sum (=sum of the first 3 products) for this product. Again we need to use CALCULATETABLE() to retain other filters on the DimProduct-table.


The third step is pretty easy – we need to calculate percentage of the cumulated sales vs. the total sales:

CumSA% CurrentProducts:=
[CumSA CurrentProducts]
/
CALCULATE([SUM SA], ALL(DimProduct[ProductAlternateKey]))

This calculation is straight forward and should not need any further explanation.

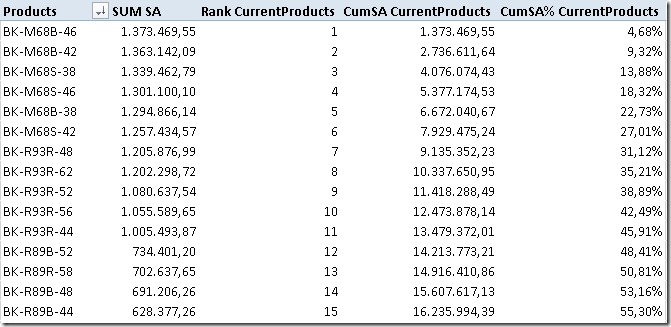
The result of those calculations can be seen here:

Theory


To do our final classification we have to extend our model with a new table that holds our classes and their border-values:

Class LowerBoundary UpperBoundary
A 0 0.7
B 0.7 0.9
C 0.9 1

Class A should contain products which’s cumulated sales are between 0 and 0.7 – between 0% and 70%.
Class B should contain products which’s cumulated sales are between 0.7 and 0.9 – between 70% and 90%.
etc.

(This table can later be extended to support any number of classes and any boundaries between 0% and 100%.)

To get the boundaries of the selected class we create two measures that are later used in our final calculation:

MinLowerBoundary:=MIN([LowerBoundary])
MaxUpperBoundary:=MAX([UpperBoundary])


Our final calculation looks like this:

SA Classified Current:=IF(NOT(ISCROSSFILTERED(Classification[Class])),
[SUM SA],
CALCULATE(
[SUM SA],
FILTER(
VALUES(DimProduct[ProductAlternateKey]),
[MinLowerBoundary] < [CumSA% CurrentProducts]
&& [CumSA% CurrentProducts] <= [MaxUpperBoundary])))

If our Classification-table is not filtered, we just show our [SUM SA]-measure. Otherwise we extend the filter on our DimProduct[ProductAlternateKey] using our classification filtering out all products that do not fall within the borders of the currently selected class.

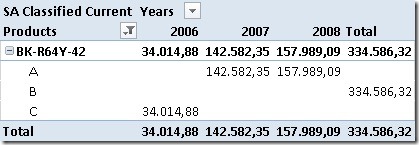
This measure allows us to see the changes of the classification of a specific product e.g. over time:

FinalResults_1

In 2006 our selected product was in Class C. For 2007 and 2008 it improved and is now in Class A. Still, overall it resides in Class B.

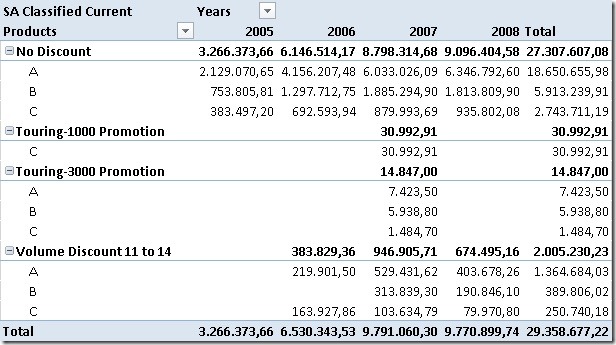
We may also analyze the impact of our promotions on the sales of our classified products:

FinalResults_2

Our Promotion “Touring-1000 Promotion” only had impact on products in Class C so we may consider to stop that promotion and invest more into the other promotions that affect all classes.


The classification can be used everywhere you need it – in the filter, on rows or on columns, even slicers work. The only drawback is that the on-the-fly calculation can take quite some time. If I find some time in the future i may try to further tune them and update this blog-post.


The example workbook can be downloaded here:

Though it is already in Office 2013 format an may not be opened with any previous versions of Excel/PowerPivot.
It also includes a second set of calculations that use the same logic as described above but does all the calculations without retaining any filters on the DimProducts-table. This allows you to filter on Class “A” and ProductSubcategory “Bike Racks” realizing that “Bike Racks” are not a Class “A” product or to see which Subcategories or Categories actually contain Class A, B or C products!

Relationships on columns with non-unique values and how to tune them

If you follow my blog frequently, you may have realized that in many of them I cover scenarios where I need to create relationships on columns with non-unique values. For example when handling SCD2 facts and dimensions or dealing with parallel hierarchies. In all the examples I use a combination of FILTER– and CONTAINS-function to create those non-unique relationships between tables. Recently I ran into performance issues using this approach and was thinking about on how to tune those kind of "relationships".

First of all I was taking a look at the DAX Query Plan using SQL Server Profiler to get some more information on what’s going on inside xVelocity and DAX. I used an calculation from my previous post as an example:

Value_Sender:=
CALCULATE([Value_SUM],
FILTER(
     'Facts',
     CONTAINS(
          'Sender',
          'Sender'[SenderID],
          'Facts'[SenderID]))
)

We had to use this calculation as SenderID was not unique in our Sender-table (and of course also not in our Facts-table). When we tried to create a relationship we got the error

Error

"The relationship cannot be created because each column contains duplicate values. Select at least one column that contains only unique values."

This makes absolutely sense as tabular models natively only support 1:n / n:1 relationships and therefore at least one column has to contain only unique vales.

The calculation from above using FILTER and CONTAINS still allowed us to link our tables on those non-unique column values. The drawback of the calculation is that it may not perform very well as it cannot use the full power of xVelocity that heavily relies on predefined relationships between columns and tables. But in our case we create the relationship on-the-fly not using xVelocity’s full potential. Further, by using CONTAINS, which is not a native xVelocity-function, the engine has to callback to DAX formula engine as we can see in the profiler:

VertiPaq SE Query / 0 – VertiPaq Scan (8 times of which 4 are of subclass Internal)

VertiPaq_SE_Query_CONTAINS

[CallbackDataID(….)] is always an indicator that the xVelocity engine could not resolve the query on its own but had to call functions from the DAX formula engine as Jeffrey Wang described here. This in the end results in poor query performance (at least compared to a pure xVelocity query).

DAX Query Plan / 1 – DAX VertiPaq Logical Plan (just for sake of completeness)

QueryPlan_CONTAINS


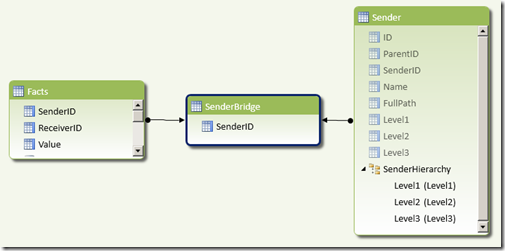
So the key to tune those kind of relationships is to relate the tables at design time to get full xVelocity performance at query time. As the tables cannot be related directly, we have to add an intermediate table containing only unique values – in our case unique SenderIDs. This table can then be used to create 1:n relationships with our Sender and our Facts table

SenderID
TOT
EUROPE
GER
FR
NA
USA
CAN
EXTERNAL
TOT_2
JV
HOLD

If you are using a SQL database as datasource you can simply create a view using SELECT DISTINCT or write the select statement directly in PowerPivot.

Once the table has been added we can create relationships as shown below:

Relationships

This design is similar to a many-to-many design with the only difference that we combined our intermediate table and our bridge table into one single table. The rest is similar to resolving many-to-many relationship as I described here. So once we have created these relationships we can change our calculations as follows:

Value_Sender_Bridge:=
CALCULATE(
     [Value_SUM],
     'SenderBridge',
     'Sender'
)

This calculation can be resolved by the xVelocity engine without any callbacks to DAX formula engine. Taking a look at the profiler trace proves this:

VertiPaq SE Query / 0 – VertiPaq Scan (4 times of which 2 are of subclass Internal)

VertiPaq_SE_Query_CROSSTABLE

None of the Veripaq SE queries used [CallbackDataID(….)] or any other complex function. Only joins have been used which can be handled by the xVelocity engine very easily:

DAX Query Plan / 1 – DAX VertiPaq Logical Plan (just for sake of completeness)

QueryPlan_CROSSTABLE

Also the logical plan could be drastically simplified containing only Sum_Vertipaq and Scan_Vertipaq operators telling us that the query can be executed in pure Vertiscan mode.

Details on Vertipaq operators and Vertiscan mode can be found here.


I have not run a lot of tests on bigger tables yet where I could have compared the overall performance but this may follow in a later post. With this post I just wanted to show how to link tables on columns containing non-unique values.

It would be great if tabular models would support those kind of relationships out of the box and that you can create them like any other relationships using drag&drop in the diagram view. This would have made many of my previous workshops at customers much easier Smile.

Consolidation and Intercompany Elimination with parallel hierarchies

In my last post I described and approach on how to calculate consolidated values (adjusted by intercompany eliminations) using PowerPivot and DAX. In this post I will extend this technique so it can also be used with parallel hierarchies as this is also very common in financial applications.

Switching from a single hierarchy to multiple parallel hierarchies has several drawbacks for tabular models:
1) business keys cannot be used to build the PC-hierarchy as they are not unique anymore
2) artificial keys and parent-keys are required
3) as business keys are not unique anymore, we also cannot create a relationship between facts and our dimension
4) PowerPivot tables do not support “UNION” to load several single hierarchies and combine them

All the issues described above have to be handled before the hierarchies can be loaded into PowerPivot. This is usually done in a relational database but this will not be covered in this post.

For simplicity I created a table in Excel that already has the correct format:

IDParentIDSenderIDName
1 TOTMy Whole Company by Region
21EUROPEEurope
32GERGermany Company
42FRFrench Company
51NANorth America
65USAUS Company
75CANCanadian Company
-99 EXTERNALEXTERNAL
8 TOT_2My Whole Company Legal View
98JVJoint Ventures
109FRFrench Company
119USAUS Company
128HOLDMy cool Holding
1312GERGermany Company
1412CANCanadian Company

We have 2 parallel hierarchies – “My Whole Company by Region” and “My Whole Company Legal View”. In PowerPivot this looks like this:

Each Company can be assigned to different nodes in every hierarchy.

As I already noted above, the SenderIDs are not unique anymore, and therefore we cannot create a relationship to our fact-table. So we have to handle this in our calculation. The approach is similar to handling SCD2 dimensions in PowerPivot what I described in previous posts (Part1 and Part2). We use CONTAINS-function to filter our fact-table based on the currently active SenderIDs in the dimension-table:

Value_Sender:=
CALCULATE([Value_SUM],
FILTER(
     'Facts',
     CONTAINS(
          'Sender',
          'Sender'[SenderID],
          'Facts'[SenderID]))
)

Actually this is the only difference in the calculation when we are dealing with multiple parallel hierarches. The other calculations are the same with the only difference that we have to use [Value_Sender] instead of [Value_SUM]:

Value_Internal:=
 CALCULATE([Value_Sender],
 FILTER(
      'Facts',
      CONTAINS(
           'Sender',
           'Sender'[SenderID],
           'Facts'[ReceiverID]))
 )

and

Value_External:=
 CALCULATE([Value_Sender],
 FILTER(
      'Facts',
      NOT(
           CONTAINS(
                'Sender',
                'Sender'[SenderID],
                'Facts'[ReceiverID])))
 )

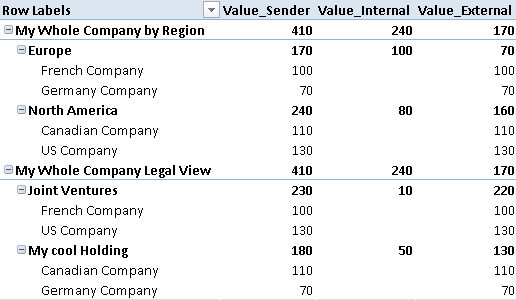
As you can see this approach also works very well with multiple hierarchies. In the end we get the desired results:

Taking a look at “My cool Holding” we see that a value of 50 is eliminated as there have been sales from CAN to GER. On top-level of the hierarchy we see the same values being eliminated (170) as both hierarchies contain the same companies and therefore only sales to EXTERNAL can summed up to get the correct value.

As this technique operates on leaf-level it works with all possible hierarchies regardless of how many companies are assigned to which node or how deep the hierarchies are!

(Just to compare the values from above – the fact-table is the same as in the previous post: )

SenderIDReceiverIDValue
FRGER100
CANGER50
GEREXTERNAL70
USACAN30
USAFR10
USAEXTERNAL90
CANUSA50
CANEXTERNAL10

Consolidation and Intercompany Elimination made easy using PowerPivot and DAX

In my past years as a consultant for Microsoft BI I had to deal with financial models quite a lot. They are usually small in size but very complex in terms of calculations like currency conversion, margin-calculations, benchmarks and so on. Another topic I came across very frequently was consolidation and intercompany eliminations. Recently I had to deal with this topic again and thought of how this could be solved in PowerPivot/DAX.

First of all a little background information on what consolidation and intercompany eliminations are. In bigger companies with several subsidiaries those subsidiaries are usually structured in some way – e.g. by legal entity, by country etc..

Here is a little example of a corporate group called “My Whole Company” with subsidiaries in Germany, France, USA and Canada, structured by geography:

These companies also make business with each other and also with external customers. The French Company and the Canadian Company sell something to the Germany Company, US Company sells goods to the Canadian Company and French Company and so on.

To get a consolidated value for higher nodes (e.g. Europe), transactions between companies within Europe have to be eliminated. Otherwise sales within Europe would be aggregated up even though the goods never left Europe and therefor cannot be added to Europe’s sales.

(I am not a financial guy so I focused on the technical stuff rather then on the business backgrounds. This whole example just demonstrates a general approach to solve this issue technically.)

Our fact-table contains columns for the SenderCompany, ReceiverCompany and Value:

SenderIDReceiverIDValue
FRGER100
CANGER50
GEREXTERNAL70
USACAN30
USAFR10
USAEXTERNAL90
CANUSA50
CANEXTERNAL10

For our Sender and Receiver-Table we can use the same source-table (details on this follow):

SenderIDParentSenderIDName
TOT My Whole Company
EUROPETOTEurope
GEREUROPEGermany Company
FREUROPEFrench Company
NATOTNorth America
USANAUS Company
CANNACanadian Company
EXTERNAL EXTERNAL

Note that we use a parent-child hierarchy here as most financial applications use them to represent hierarchical structures. The parent-child hierarchy is resolved using PATH(), PATHITEM() and LOOKUPVALUE() functions as described here by Alberto Ferrari. The final table is added twice to our model, for Sender and Receiver:

(for simplicity I removed all other columns of the fact-table and their corresponding dimension-tables).

The next step is to implement the business logic for consolidation and intercompany elimination. From the description above we can break this logic down into smaller pieces. To get a consolidated value, we have to:

  1. Select only Senders below the currently selected SenderHierarchy-Node
  2. Select only Receivers, that are NOT below the ReceiverHierarchy-Node that is equal to the currently selected SenderHierarchy-Node
  3. Sum up the remaining fact-rows
Value_SUM:=SUM(Facts[Value])
Value_Internal:=
 CALCULATE(
      [Value_SUM],
      FILTER(
           'Receiver',
           CONTAINS(
                'Sender', 
                'Sender'[SenderID], 
                'Receiver'[ReceiverID])))

The Receiver-table is filtered using the CONTAINS-function. As FILTER operates row-by-row, each ‘Receiver’[ReceiverID] is checked whether its value can also be found in the currently selected SenderIDs. In T-SQL this would be similar to:

SELECT SUM([Value]
 FROM Facts
 INNER JOIN Sender
     ON Facts.SenderID = Sender.SenderID
 INNER JOIN Receiver
     ON Facts.ReceiverID = Receiver.ReceiverID
 WHERE Receiver.ReceiverID IN (SELECT SenderID 
                               FROM Sender 
                               WHERE Level2='Europe')
 AND Sender.Level2 = 'Europe'

Once you understand how the T-SQL, the DAX-calculation should also be clear.

Value_External:=
 CALCULATE(
      [Value_SUM],
      FILTER(
           'Receiver',
           NOT(
                CONTAINS(
                     'Sender', 
                     'Sender'[SenderID], 
                     'Receiver'[ReceiverID]))))

And this is already our final calculation to eliminate intercompany sales and get a consolidated value for any Sender-node we select!

Europe has total sales of 170 of which 100 have been internal (FR to GER) and 70 have been external (GER to EXTERNAL). North America has a total value of 240 of which 80 have been internal (USA to CAN 30 and CAN to USA 50) and 160 have been sold external to either Europe or external customers.

The calculation can be further simplified in terms of usability. You may already realized that we did not refer to our hierarchy within any of our calculation. We always used the leaf-level (SenderID/ReceiverID) to calculated our values. To solve the original problem in a multidimensional model we had to create a Receiver-dimension and select/deselect members based on the current selection in the Sender-hierarchy. This is not necessary anymore as we only use leaf-elements in our calculation. So we do not need a Receiver-hierarchy and further also no Receiver-table in our PowerPivot-model as we already have the ReceiverID in our Facts-table:

Value_External_Facts:=
 CALCULATE(
      [Value_SUM]; 
      FILTER(
           'Facts'; 
           NOT(
                CONTAINS(
                     'Sender'; 
                     'Sender'[SenderID];
                     'Facts'[ReceiverID]))))

There may also be reasons that the user wants to select the Receiver-Node on its own. For example to see sales from European to external customers (EXTERNAL).  To do this you have to adopt the calculation as follows:

Value_Selected:=CALCULATE(
      [Value_SUM];
       FILTER(
           ALL(Receiver); 
           NOT(
                CONTAINS(
                     'Receiver'; 
                     'Receiver'[ReceiverID];
                     'Receiver'[ReceiverID]))))

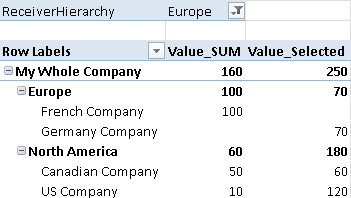
This calculation may look strange on first sight but does exactly what we need. It removes all filters from the Receiver-table and applies a new filter that is the opposite of the currently existing filter using a combination of NOT() and CONTAINS(). The 3rd parameter of the CONTAINS-function always refers to the row-context of the FILTER-function whereas the 1st and the 2nd parameter are always based on the current query-context.

These are the results:

You could also use the Value_SUM-calculation to get the opposite value – what has been sold from the current Sender-node to any Receiver located in Europe. Our Canadian Company for example has sold 50 to GER which is below Europe and 60 to companies outside Europe – in this case 50 to USA and 10 to EXTERNAL.

As you can see using DAX makes these kind of calculations very easy compared to multidimensional models. An other important aspect is that financial models are usually very small and therefor should fit into memory very easily. Also the independence of hierarchies is an important aspect here.

You can also download the Excel-Workbook with the sample-calculations here:

Consolidation.xlsx

UPDATE:

In Part2 I will show how to handle multiple parallel hierarchies.

Resolving Many to Many relationships leveraging DAX Cross Table Filtering

If you ever had to deal with many-to-many relationships in PowerPivot then I am quite sure that you came across the blog-post Many-to-Many relationships in PowerPivot by Marco Russo and PowerPivot and Many to Many Relationships by Alberto Ferrari. Both posts describe how this issue can be solved using DAX and provide examples and also very good background information on that topic.

I recently had to struggle with many-to-many relationships again at one of my customers who complained that many-to-many relationships are just too complex. So I rethought of the problem and searched for alternatives. During my investigations I  also found Jeffrey Wang’s blog-post The Logic behind the Magic of DAX Cross Table Filtering again – a must read blog for all people interested in BISM (tabular and multidimensional), DAX or MDX. In the middle of the post he describes the single operations the CALCULATE-function performs:

Calculate function performs the following operations:
1. Create a new filter context by cloning the existing one.
2. Move current rows in the row context to the new filter context one by one and apply blocking semantics against all previous tables.
3. Evaluate each setfilter argument in the old filter context and then add setfilter tables to the new filter context one by one and apply blocking semantics against all tables that exist in the new filter context before the first setfilter table is added.
4. Evaluate the first argument in the newly constructed filter context.

(the single steps are described in more details in his post)

Important for us is the fact, that you can pass tables as arguments to the CALCULATE-function and those tables are automatically filtered by the current context. Even more important is that this filtering works in both directions of a relationships. So adding a table that has an exiting relationship with any table in the current context is similar to a JOIN in terms of SQL. Filters applied to the newly joined tables are also propagated through all other tables, regardless of the direction of the relationship.

In his Question #1 Jeffrey counts the number of Subcategories for a given Product as an example (which is always 1 as there is a 1:n relationship between DimSubCategory and DimProduct). To get the correct value he uses the following calculation to extend the filter context by DimProduct and thereby also filtering DimProductSubcategory indirectly:

CALCULATE(COUNTROWS(DimProductSubcategory), DimProduct)


Knowing that we can use CALCULATE to resolve 1:n relationships in both directions we can also use this approach to solve m:n relationships pretty easy!

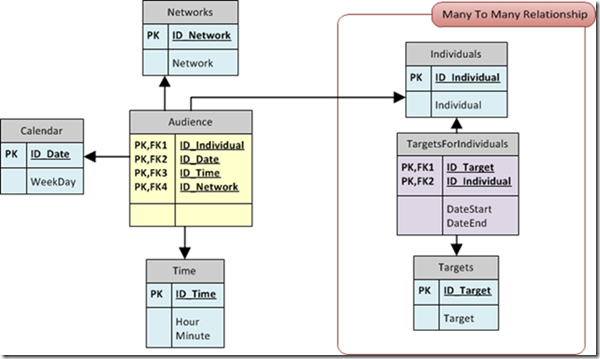
Alberto Ferrari uses an example where the facts are related to Individuals. Those Individuals can be assigned to 1 or more Targets. This mapping is done using a bridge table to model the many-to-many relationship:

M2M_AlbertoFerrari

As you can see there is no "real" many-to-many relationship in the model as it has already been split up into a bridge-table using 1:n and n:1 relationships. Adding the information from above to this model we come up with a pretty easy DAX calculations which resolves the many-to-many relationship. Here is a little example where we simply count the rows in our Audience table:

RowCount:=COUNTROWS('Audience')

This RowCount is currently not filtered by table Targets as there is no chain of 1:n relationships between Targets and Audience. Only filters applied to directly related tables (Individuals, Time, Calendar and Networks)  are considered when the calculation is evaluated.

By wrapping a CALCULATE-function around our calculation and adding the tables that participate in the many-to-many relationship as parameters we explicitly extend the filter context for our calculation. As filters on those "extended tables" also impact the current filter-context, the value for our Targets also changes according to the Individuals belonging to the current Target:

RowCount_M2M:=CALCULATE(
     [RowCount], 
     'Individuals', 
     'TargetsForIndividuals', 
     'Targets')

Finally, to resolve the many-to-many relationship for our calculation all we have to do is to explicitly add all tables of the many-to-many relationship to the filter-context of our calculation by using the CALCULATE-function. The rest is done automatically by DAX’s Cross Table Filtering Logic!

The calculation can be further extended to only apply this logic when there is a filter on table Targets, otherwise we do not have to resolve the many-to-many relationship:

RowCount_M2M:=IF(ISCROSSFILTERED('Targets'[Target]),
CALCULATE(
     [RowCount], 
     'Individuals', 
     'TargetsForIndividuals'),
[RowCount])

Doing this ensures that the more complex calculation is only executed when there is a filter on table Targets. Further we already know that Targets is already part of the current context and therefore does not have to be added again for our calculation.

In the end we come up with a solution where we only have to add the intermediate table (Individuals) and the bridge table (TargetsForIndividuals) to our CALCULATE-functions to resolve the many-to-many relationship – pretty nice, isn’t it?

I think this approach should also be very easy to understand for people that are familiar with SQL and relational databases and just switched to tabular modeling.

The PowerPivot workbook with samples for all approaches can be downloaded here:

Handling SCD2 snowflake-schemas with PowerPivot

In my previous post I wrote about how to use PowerPivot on top of a relational database that is modeled as a star-schema with slowly changing dimension type 2 (SCD2) historization. In this post I will advance this approach by adding other tables tables that are not related to our facts but have a relationship to our current dimension tables based on an other attribute.

I will take the example from my previous post and extend it by a new table called "WarehouseOwner". This table looks as follows:

WarehouseOwner

Warehouse
Owner_SID
Warehouse
Owner_BK
Manager VALID_FROM VALID_TO
1 John Peter 2012-01-01 2012-01-03
2 Dave Peter 2012-01-01  
3 John Dan 2012-01-03  

This table holds information about the warehouse owner and its manager. In this example the manager of John changed from Peter to Dan with the 3rd of January. Remember that we have a WarehouseOwner-Column also in our Warehouse-table.

Logically this new table can be related to our Warehouse-table but as PowerPivot only supports 1:n relationships this is natively not supported and we have to use DAX to simulate this relationship. Most of the steps are similar to the steps that we have already done for our other SCD2-tables. First of all we create a ‘IsValid’-measure to identify rows that are valid for the selected referencedate:

WarehouseOwner_IsValid:=COUNTROWS(
FILTER(
     WarehouseOwner; 
     (WarehouseOwner[VALID_FROM] <= 'Date'[ReferenceDate] 
        || ISBLANK(WarehouseOwner[VALID_FROM]))
     && (WarehouseOwner[VALID_TO] > 'Date'[ReferenceDate] 
        || ISBLANK(WarehouseOwner[VALID_TO]))))>0

The next step would be to mimic a relationship between our Inventory-table and our WarehouseOwner-table. But opposed to our old star-schema where each table was directly related to the Inventory-table, this is not possible with our new snowflake-schema anymore. So we have to relate our WarehouseOwner-table with our facts using the Warehouse-table. Without any relationship the result would look as follows:

WarehouseOwner_unrelated

This result is similar to a crossjoin of our Managers and our Warehouse-Owners regardless of time and validity. But we need to analyze which Manager was responsible for which warehouse owners and respectively their warehouse at any given point in time. To relate our tables we have to identify the combinations that are valid for the selected referencedate. If you reconsider these requirements, you will realize that this is similar to the relationships that we had to define to link our other tables to the inventory-table.  Again we can use CONTAINTS()-function in combination with FILTER() and a IsValid-Measure but in this case we use them in our Warehouse-table to extend our Warehouse_IsValid-Measure:

Warehouse_IsValid_New:=COUNTROWS(
FILTER(
     Warehouse; 
     (Warehouse[VALID_FROM] <= 'Date'[ReferenceDate] 
		|| ISBLANK(Warehouse[VALID_FROM]))
     && (Warehouse[VALID_TO] > 'Date'[ReferenceDate] 
		|| ISBLANK(Warehouse[VALID_TO]))
     && CONTAINS(
		FILTER(
			VALUES(WarehouseOwner[WarehouseOwner_BK]);
			WarehouseOwner[WarehouseOwner_IsValid]); 
		WarehouseOwner[WarehouseOwner_BK]; 
		Warehouse[WarehouseOwner_BK])))>0

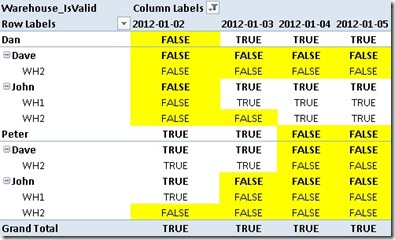
Using our new Warehouse_IsValid-measure in a PivotTable reveals which combinations are valid for a given time:

WarehouseOwner_IsValid

Actually this is already all we have to do here to get the desired result, we do not have to touch any other formula in our model! By replacing our Warehouse_IsValid-Measure with our previous Amount-Measure we can see the final result:

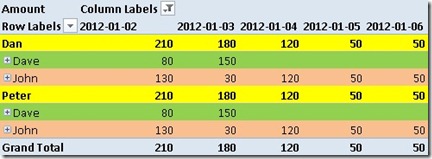
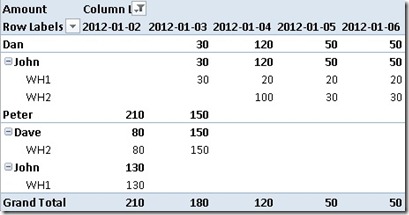
WarehouseOwner_related

When Dan becomes the Manager of John with the 3rd of January also the facts that are related to warehouses belonging to John are associated with Dan. As with the 4th of January John also becomes the owner of WH2 (now owning both/all warehouses) Dave and also its manager Peter do not have any facts related to them anymore.

As you can see this approach can be very easily extended by new tables even if the they are modeled in a snowflake-schema. All you have to do is to modify the IsValid-Measure of the main-table that relates to the new table.


Stay tuned for the next post where I will analyze the performance of this solution with large amounts of data!

Download Final Model

Handling SCD2 Dimensions and Facts with PowerPivot

Having worked a lot with Analysis Services Multidimensional Model in the past it has always been a pain when building models on facts and dimensions that are only valid for a given time-range e.g. following a Slowly Changing Dimension Type 2 historization. Opposed to relational engines, Analysis Services Multidimensional Model does not support complex relationships that would create more than one matching row like in terms of SCD2 a join using T-SQL’s BETWEEN. In Multidimensional Models each fact-row has to be linked to exactly one member in a dimension. There are some techniques to mimic BETWEEN-Joins like abusing ManyToMany-Relationships but all of them have several drawbacks and are just workarounds that do not solve the actual problem.

Fortunately PowerPivot (and in the future Analysis Services Tabular Models that are part of SQL Server 2012) offer more flexibility on modeling data and relationships that we can leverage to solve such scenarios.

In this post I will cover a warehouse-scenario where articles are stored in warehouses for a given period of time. The model should allow analysis of the current stock on a daily base. All tables follow a SCD2 historization and shall always display the currently valid records for the selected time.

Our model consists of 4 tables:

Article:

Article_SID Article_BK ArticleGroup VALID_FROM VALID_TO
1 A1 AG1 2012-01-01 2012-01-03
2 A2 AG2 2012-01-01  
3 A1 AG2 2012-01-03  

Warehouse:

Warehouse_SID Warehouse_BK WarehouseOwner_BK VALID_FROM VALID_TO
1 WH1 John 2012-01-01  
2 WH2 Dave 2012-01-01 2012-01-04
3 WH2 John 2012-01-04  

Date:

Contains Date-Values from 2012-01-01 till 2012-01-15

Inventory (Facts):

Article_BK Warehouse_BK Amount_BASE VALID_FROM VALID_TO
A1 WH1 100 2012-01-01 2012-01-03
A1 WH2 50 2012-01-02 2012-01-04
A1 WH1 20 2012-01-01  
A2 WH1 10 2012-01-01 2012-01-04
A2 WH2 70 2012-01-03 2012-01-05
A2 WH2 30   2012-01-10

As you can see our facts are related using the BusinessKey (BK) and are thereby independent of any historical changes within any dimension.

This means that SCD2-changes in dimension have no impact on our fact-table reducing most of the complex ETL that is usually required to propagate those changes to the fact-table to allow in-time analysis

Once you have loaded these tables into PowerPivot and try to create relationships you will get errors as none of the tables can be related as the BKs are not unique in any table. But that’s OK as all tables have to be filtered on the ReferenceDate first to show the structure at selected date.

So, how can we find out which rows are currently active?

First of all we have to create a measure that returns the LastDate in the current time-slice (assuming that we always want to get the most current structures, e.g. 31st of December when doing analysis over a whole year etc.)

Using LASTDATE()-function this can be accomplished very easily:

ReferenceDate:=LASTDATE('Date'[Date]) 

All other tables have to be filtered on this ReferenceDate to get only the valid rows at this point in time.

I used a combination of COUNTROWS() and FILTER() to create a measure that identifies a value as valid or not:

For our Article-Table:

Article_IsValid:=COUNTROWS(
FILTER(
    Article;
    (Article[VALID_FROM] <= 'Date'[ReferenceDate]
        || ISBLANK(Article[VALID_FROM]))
    && (Article[VALID_TO] > 'Date'[ReferenceDate]
        || ISBLANK(Article[VALID_TO]))))>0

For our Warehouse-Table:

Warehouse_IsValid:=COUNTROWS( 
FILTER(
    Warehouse;
    (Warehouse[VALID_FROM] <= 'Date'[ReferenceDate]
        || ISBLANK(Warehouse[VALID_FROM]))
    && (Warehouse[VALID_TO] > 'Date'[ReferenceDate]
        || ISBLANK(Warehouse[VALID_TO]))))>0

And also for our Fact-Table:

Inventory_IsValid:=COUNTROWS( 
FILTER(
    Inventory;
    (Inventory[VALID_FROM] <= 'Date'[ReferenceDate]
        || ISBLANK(Inventory[VALID_FROM]))
    && (Inventory[VALID_TO] > 'Date'[ReferenceDate]
        || ISBLANK(Inventory[VALID_TO]))))>0

Using a pivot-table we can see the WarehouseOwner changing over time. The owner of WH2 changes to John with 2012-01-04, as Dave does not own any warehouse by that time anymore, his entry also gets invalidated:

PT_Warehouse_IsValid_thumb[2]

To get the valid Amount at a given ReferenceDate we have to sum only the valid rows for that date:

Amount:=CALCULATE( 
SUM( 
      [Amount_BASE]); 
      FILTER(Inventory; Inventory[Inventory_IsValid]))

This calculation is not linked to any other table at the moment but this can be achieved by adding further criterias to the FILTER-function.

Using CONTAINS()-function we can simulate relationships based on the BusinessKeys:

Amount:=CALCULATE( 
SUM(
    [Amount_BASE]); 
    FILTER(
        Inventory;
        Inventory[Inventory_IsValid] 
        && CONTAINS(
            FILTER(VALUES(Article[Article_BK]); Article[Article_IsValid]);
            Article[Article_BK];
            Inventory[Article_BK]) 
        && CONTAINS(
            FILTER(VALUES(Warehouse[Warehouse_BK]);Warehouse[Warehouse_IsValid]);
            Warehouse[Warehouse_BK];
            Inventory[Warehouse_BK])))

For each table that we want to relate we have to add another CONTAINS()-function to our calculation to mimic a relationship.

Taking the relationship to table ‘Warehouse’ as an example:

VALUES(Warehouse[Warehouse_BK]) returns only rows/BKs within the current context of table Warehouse.

Those rows are further filtered by the ReferenceDate using our [Warehouse_IsValid]-Measure returning only rows that are valid for the selected ReferenceDate.

The two other parameters of the CONTAINS()-function define the columns that are matched.

Doing this for all tables allows us to analyze our current stock-level with the current structures at any given point in time:

PT_Amount_by_Warehouse_thumb[1]

As empty rows are suppressed from pivot-tables by default, we get the desired result when filtered on a specific date:

PT_Amount_by_Warehouse_SingleDate_thumb[2]

I have not tested his approach yet in terms of performance when it comes to bigger volumes of data, this will be part of an upcoming post.

Further I will show how this approach can be extended to support snowflaked schemas as they are very often found in data warehouses.


Part2: Handling SCD2 snowflake-schemas with PowerPivot


Download Final Model