Using Custom Libraries in Microsoft Fabric Data Engineering

When working with Spark or data engineering in general in Microsoft Fabric, you will sooner or later come to the point where you need to reuse some of the code that you have already written in another notebook. Best practice is to put these code pieces into a central place from where it can be referenced and reused. This way you can make sure all notebooks always use the very same code and it is also easy to develop, update and test the common functions.

The first thing you would usually end up putting the common code in a dedicated notebook – lets call it MyLibrary and have a %run MyLibrary at the beginning of the referencing notebooks. This will basically execute the code from your utils notebook before the following cells. For simple scenarios this is usually fine but it can get quite messy when you start nesting those calls to %run and if the referenced notebooks get very long. Also, at some point you will realize that the performance suffers with the amount of code you import this way.
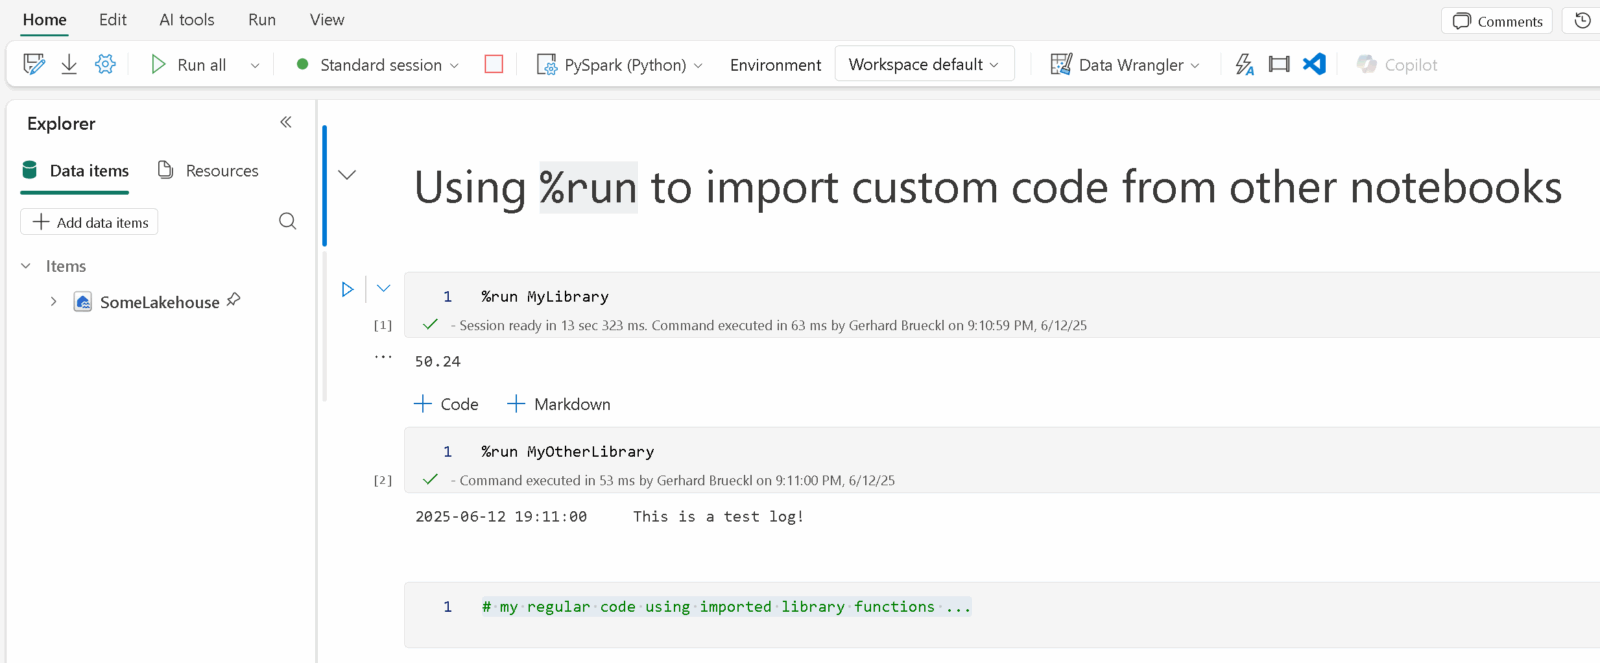
However, the nice thing about this approach is that you can develop your utils/library side-by-side with your notebooks and you do not need any external tools to manage your library which, especially for data engineers with little software engineering background, is a big plus as they do not need to learn any new tools.

Over time your library will grow and you will look for a “more professional” way to manage your library. That`s where python libraries, packaging and in the end Fabric Environments come into play. Now you are entering the world of software engineering which you may not be very familiar with. While this provides a lot of benefits, its also introduced a lot more complexity and a different way of working – usually outside of Fabric. A .whl file is built outside of fabric and uploaded and attached to an Environment in Fabric. Your notebooks then reference this Environment and inherit all settings from there instead of the Starter Pool.
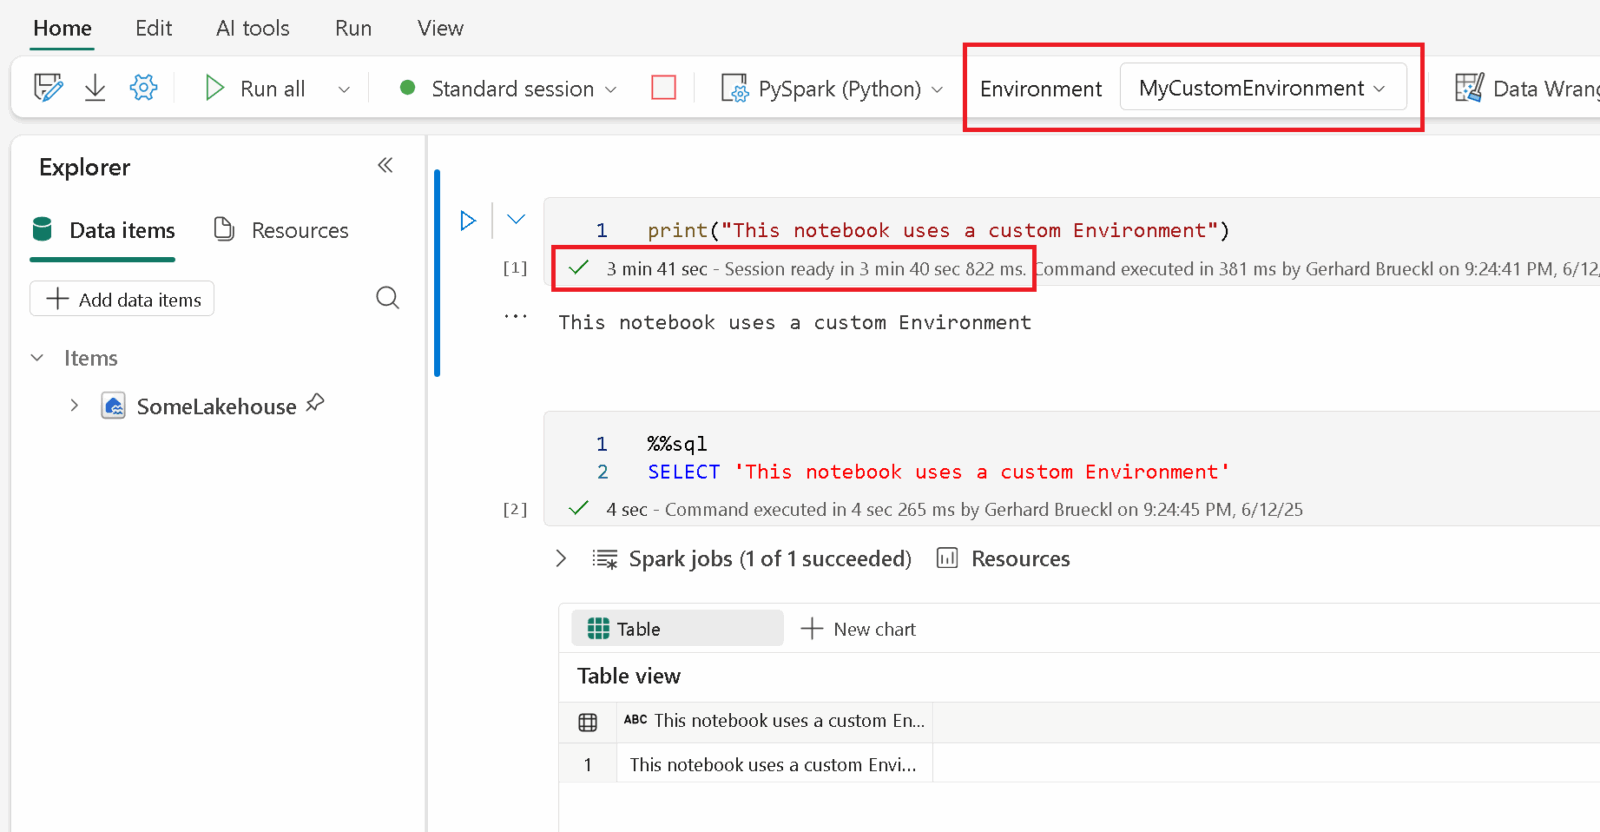
As you can imagine, this also has some drawbacks which you should be aware of before going down this path:

  • You need to attach your notebooks to an environment
  • notebooks attached to a custom environment will suffer from a longer cluster startup
  • whenever you change code in your library, you need to build it, publish it, attach it to your environment and restart the kernel of the notebook that consumes it

This will significantly increase the development time for your regular notebooks, especially if you are still constantly changing or extending the library. Updating an existing environment just took about 15 minutes(!) + the increased cluster startup time. All in all not really great if your library is still in an early stage and changes frequently.

SparkContext to the rescue!

Fortunately, there is another way too which is not specific to Microsoft Fabric but a feature of Spark in general: SparkContext.addPyFile()

This function allows you to inject custom Python/PySpark code into your current Spark context. The code file – a .py or .zip file – can reside anywhere as long as it is accessible from the Spark cluster. The typical file storage within Microsoft Fabric would be the /Files section of a lakehouse which can be used in any notebook.

Now here is what we want to achieve:

  • develop notebooks and library code side-by-side within Microsoft Fabric
  • no use of external tools (offline or online)
  • quick iteration cycles when developing the library
  • avoid Environments due to longer cluster startup times
  • updates to the library should not require any further changes in existing notebooks

To accomplish this, I have created a generic notebook which I call LibraryManager. It allows you to define a set of notebooks which should be used and bundled into a library. The LibraryManager uses the Fabric REST API to download those notebooks as .py files into a lakehouse, compresses them into a .zip file and generates another notebook (load_LibraryManager) that then imports this .zip file using sc.addPyFile(). The notebooks that need to use your library can then simply use %run load_LibraryManager to import all the common code defined in your library. If the library evolves, the new functions will be available in all notebooks immediately without any further todos.

To make changes to the code in the library, I can now simply open the respective notebook in Fabric, and change the code as necessary. Then manually I run the LibraryManager notebook which only takes a couple of seconds to finish. Last but not least I restart the kernel of the referencing notebook and run it again which will load the most recent version of the library that I just updated. All-in-all this takes about 10 seconds and I do not need to leave Fabric.

Another nice aspect of this is that your library is now also part of your git repository and you always have a consistent state of notebooks and libraries and no dependency hell. The only thing you need to do is to run the LibraryManager notebook after each new deployment to make sure the library in the Lakehouse is up-to-date.

Now some people will argue that this is not professional and a library should have unit and integration tests and some proper versioning and release cycles and so on and so forth. And yes, you are right, for enterprise scale projects, that’s definitely the way to go! But if you only need a way to manage and share common code used in your data pipelines, this can still be a very good alternative with a low entry point and providing rapid development cycles and iterations not blocking you in any way and giving you a lot of flexibility.

Let me know what you think in the comments!

The LibraryManager notebook and a small sample of this can be found in my public github repository Fabric.Toolbox

Visualizing Spark Execution Plans

I recently found myself in a situation where I had to optimize a Spark query. Coming from a SQL world originally I knew how valuable a visual representation of an execution plan can be when it comes to performance tuning. Soon I realized that there is no easy-to-use tool or snippet which would allow me to do that. Though, there are tools like DataFlint, the ubiquitous Spark monitoring UI or the Spark explain() function but they are either hard to use or hard to get up running especially as I was looking for something that works in both of my two favorite Spark engines being Databricks and Microsoft Fabric.

During my research I found these two excellent blog posts (1, 2) by Semyon Sinchenko who was already dealing with Spark execution plans and how to extract valuable information from them. I took a lot of inspiration and ideas from there to build my show_plan function.

In the end I wanted to achieve three goals:

  1. and easy to use function that can be used with any Spark Dataframe (including SparkSQL)
  2. a lightweight setup that works with all Spark engines
  3. an interactive, visual representation of the execution plan (still working on the interactive part)

Installation as of now is via sc.addPyFile from my GitHub repository Fabric.Toolbox. For now thats fine I think and if the function gets more popular I will probably create a PIP package for it.

sc.addPyFile("https://raw.githubusercontent.com/gbrueckl/Fabric.Toolbox/main/DataEngineering/Library/VisualizeExecutionPlan.py")
from VisualizeExecutionPlan import show_plan

Next would be the definition of your Spark dataframe. As mentioned above, you can use any Spark dataframe regardless of how you created it (PySpark, SQL, …). For simplicity and transparency I used a SQL query in my example:

my_df = spark.sql("""
SELECT fs.*, dc.CurrencyName, ds.StoreName
FROM contoso.factsales_part fs
INNER JOIN contoso.dimcurrency dc
    ON fs.CurrencyKey = dc.CurrencyKey
LEFT JOIN contoso.dimstore ds
    ON fs.StoreKey = ds.StoreKey
WHERE fs.DateKey >= to_timestamp('2008-06-13', 'yyyy-MM-dd')
""")

display(my_df)

You can now simply pass the variable that represents your dataframe into the show_plan function:

show_plan(my_df)

As you can see, the function is very easy to install and use, its basically just 3 lines of code to give you a visual representation of your execution plan!

For Databricks, the code is slightly different to missing preinstalled libraries and limited capabilities of display() function. First we need to install graphviz using %sh and %pip. This is also partially documented in the official Databricks documentation.

%sh
sudo apt-get install -y python3-dev graphviz libgraphviz-dev pkg-config

Instead of pygraphviz as described in the docs, we install the regular graphviz package:

%pip install graphviz

Adding the library and creating the test dataframe is the same as in Fabric.

sc.addPyFile("https://raw.githubusercontent.com/gbrueckl/Fabric.Toolbox/main/DataEngineering/Library/VisualizeExecutionPlan.py")
from VisualizeExecutionPlan import *
my_df = spark.sql("""
SELECT fs.*, dc.CurrencyName, ds.StoreName
FROM contoso.factsales_part fs
INNER JOIN contoso.dimcurrency dc
    ON fs.CurrencyKey = dc.CurrencyKey
LEFT JOIN contoso.dimstore ds
    ON fs.StoreKey = ds.StoreKey
WHERE fs.DateKey >= to_timestamp('2008-06-13', 'yyyy-MM-dd')
""")

display(my_df)

Finally we need to pass the displayHTML function as a second parameter to the show_plan function:

show_plan(my_df, displayHTML)

Information for the final output is take from the physical execution plan and is enriched with data from the optimized logical execution plan which for example contains the estimated sizes. Things like the type of join (e.g. BroadcastHasJoin) is taken from the physical plan.

It is worth mentioning that the sizes are based on the table statistics and become unreliable after joins are involved. However, I think they still play in import role in performance tuning so it made sense to me to also include them in the visual representation of the plan.

There is still a lot of room for improvements like installation via PIP, interactive visualization, highlighting of important things like partition filters, etc. and I could not yet test all potential scenarios (I mainly used Delta Lake tables for my tests). So I would really appreciate any feedback to make the show_plan function more robust and user friendly. Feedback is best provided via the underlying GitHub repository Fabric.Toolbox.

Querying Power BI REST API using Fabric Spark SQL

Microsoft Fabric has a lot of different components which usually work very well together. However, even though Power BI is a fundamental part of Fabric, there is not really a tight integration between Data Engineering components and Power BI. In this blog post I will show you an easy and reusable way to query the Power BI REST API via Fabric SQL in a very straight forward way. The extracted data can then be stored in the data lake e.g. to create a history of your dataset refreshes, the state of your workspaces or any other information that is provided by the REST API.

To achieve this, we need to prepare a couple of things first:

  • get an access token to work with the Power BI REST API
  • expose the access token as a SQL variable
  • create a PySpark function to query the Power BI REST API
  • expose the PySpark function as a SQL user-defined function
  • use SQL to query the Power BI REST API

To get an access token for the Power BI REST API we can use mssparkutils.credentials.getToken and provide the OAuth audience for the Power BI REST API which would be https://analysis.windows.net/powerbi/api

pbi_access_token = mssparkutils.credentials.getToken("https://analysis.windows.net/powerbi/api")

We then need to make this token available in Fabric Spark SQL by storing it in a variable:

spark.sql(f"SET pbi_access_token={pbi_access_token}")

The next part is probably the most complex one. We need to write a Python function that runs a query against the Power BI REST API and returns the results in a standardized way. I will not go into too much detail but simply show the code. It basically queries the REST API via a GET request, checks if the result contains a property value with the results and then returns them as a list of items. Please check e.g. the GET Groups REST API call to better understand the structure of the result. The function further adds a new property to each item to make nesting of API calls easier as you will see in the final example.

import requests

# make sure to support different versions of the API path passed to the function
def get_api_path(path: str) -> str:
    base_path = "https://api.powerbi.com/v1.0/myorg/"
    base_items = list(filter(lambda x: x, base_path.split("/")))
    path_items = list(filter(lambda x: x, path.split("/")))

    index = path_items.index(base_items[-1]) if base_items[-1] in path_items else -1

    return base_path + "/".join(path_items[index+1:])

# call the api_path with the given token and return the list in the "value" property
def pbi_api(api_path: str, token: str) -> object:
    
    result = requests.get(get_api_path(api_path), headers = {"authorization": "Bearer " + token})

    if not result.ok:
        return [{"status_code": result.status_code, "error": result.reason}]

    json = result.json()

    if not "value" in json:
        return []

    values = json["value"]

    for value in values:
        if "id" in value:
            value["apiPath"] = f"{api_path}/{value['id']}"
        else:
            value["apiPath"] = f"{api_path}"

    return values

Once we have our Python function, we can make it accessible to Spark. In order to do this, we need to define a Spark data type that is returned by our function. To make it work with all different kinds of API calls without knowing all potential properties that might get returned, we use a map type with string keys and string values to cover all variations in the different APIs. As the result is always a list of items, we wrap our map type into an array type.
The following code exposes it to PySpark and also Spark SQL.

import pyspark.sql.functions as F
import pyspark.sql.types as T

# schema of the function output - an array of maps to make it work with all API outputs
schema = T.ArrayType(
    T.MapType(T.StringType(), T.StringType())
)

# register the function for PySpark
pbi_api_udf = F.udf(lambda api_path, token: pbi_api(api_path, token), schema)

# register the function for SparkSQL
spark.udf.register("pbi_api_udf", pbi_api_udf)

Now we are finally ready to query the Power BI REST API via Spark SQL. We need to use the magic %%sql to tell the notebook engine, we are running SQL code in this one cell. We then run our function in a simple SELECT statement and provide the API endpoint we want to query and a reference to our token-variable using the variable syntax ${variable-name}.

%%sql 
SELECT pbi_api_udf('/groups', '${pbi_access_token}') as workspaces

This will return a table with a single row and a single cell:

However, that cell contains an array which can be exploded to get our actual list of workspaces and their details:

%%sql
SELECT explode(pbi_api_udf('/groups', '${pbi_access_token}')) as workspace

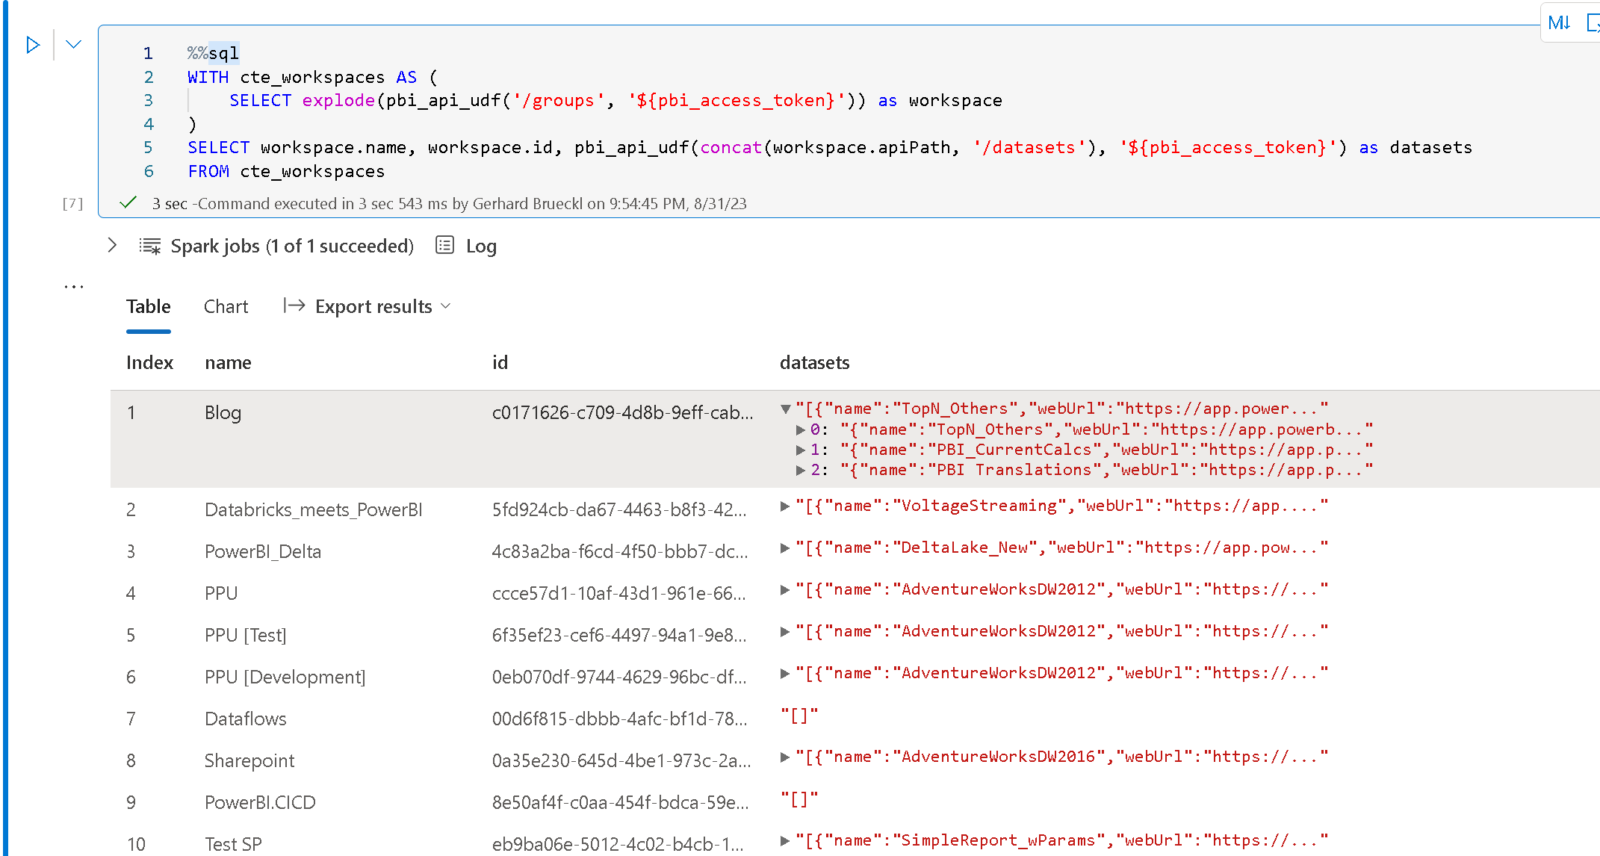
Once you understood those concepts, it is pretty easy to query the Power BI REST API via SQL as this can also be combined with other Spark SQL capabilities like CTEs, e.g. to get a list of all datasets across all workspaces as shown below:

%%sql
WITH cte_workspaces AS (
    SELECT explode(pbi_api_udf('/groups', '${pbi_access_token}')) as workspace
)
SELECT workspace.name, workspace.id, pbi_api_udf(concat(workspace.apiPath, '/datasets'), '${pbi_access_token}') as datasets
FROM cte_workspaces

As you can see, to show a given property as a separate column, you can just use the dot-notation to reference it – e.g. workspace.name or workspace.id

There are endless possibilities using this solution, from easy interactive querying to historically persisting the state of your Power BI objects in your data lake!

Obviously, there are still some things that could be improved. It would be much more elegant to have a Table Valued Function instead of the scalar function that returns an array which needs to be exploded afterwards. However, this is not yet possible in Fabric but will hopefully come soon.

This technique can also be applied to any other APIs that expose data. The most challenging part is usually the authentication but Fabric’s mssparkutils.credentials make it pretty easy for us to do this.

Connecting Power BI to Azure Databricks

I work a lot with Azure Databricks and a topic that always comes up is reporting on top of the data that is processed with Databricks. Even though notebooks offer some great ways to visualize data for analysts and power users, it is usually not the kind of report the top-management would expect. For those scenarios, you still need to use a proper reporting tool, which usually is Power BI when you are already using Azure and other Microsoft tools.

So, I am very happy that there is finally an official connector in PowerBI to access data from Azure Databricks! Previously you had to use the generic Spark connector (docs) which was rather difficult to configure and did only support authentication using a Databricks Personal Access Token.

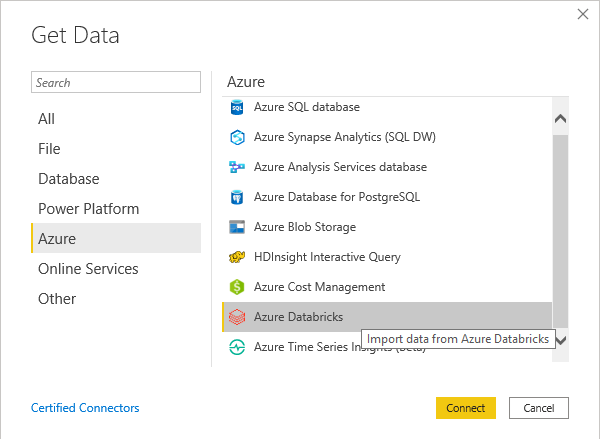
With the new connector you can simply click on “Get Data” and then either search for “Azure Databricks” or go the “Azure” and scroll down until you see the new connector:

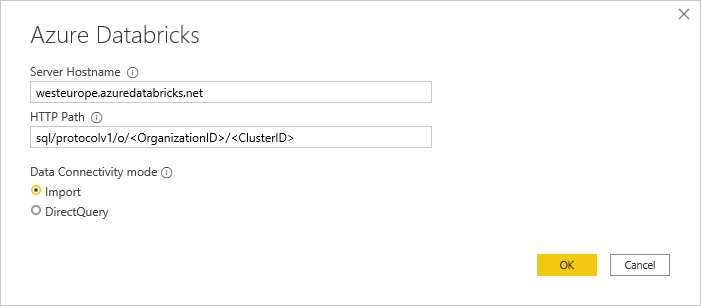
The next dialog that pops up will ask you for the hostname and HTTP path – this is very similar to the Spark connector. You find all the necessary information via the Databricks Web UI. As this connection is always bound to an existing cluster you need to go the clusters details page and check the Advanced Tab “JDBC/ODBC” as described here:
(NOTE: you can simply copy the Server Hostname and the HTTP Path from the cluster page)

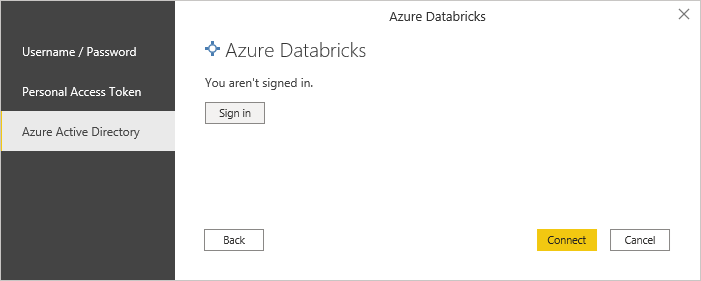
The last part is then the authentication. As mentioned earlier the new connector now also supports Azure Active Directory authentication which allows you to use the same user that you use to connect to the Databricks Web UI!
Personal Access Tokens are also still supported and there is also Basic authentication using username/password.

Once you are connected, you can choose the tables that you want to import/connect and start building your report!

Here is also a quick overview which features are supported by the Spark and the Azure Databricks connector as there are some minor but important differences:

Feature ComparisonSpark ConnectorDatabricks Connector
Power BI DesktopYESYES
Power BI ServiceYESYES *
Direct Query (Desktop)YESYES
Direct Query (Service)YESYES *
Import ModeYESYES
Manual Refresh (Service)YESYES *
Scheduled Refresh (Service)YESYES *
Azure Active Directory (AAD) AuthenticationNOYES
Personal Access Token AuthenticationYESYES
Username/Password AuthenticationYESYES
General AvailableYESYES
Performacne Improvements with Spark 3.xNO *YES *
Supports On-Premises data gatewayYESNO
Features supported by Spark and Databricks Connector for PowerBI

*) Updated 2020-10-06: the new Databricks Connector for PowerBI now supports all features also in the PowerBI service!

Update 2020-10-06: So from the current point of view the new Databricks Connector is a superset of old Spark Connector with additional options for authentication and better performance with the latest Spark versions. So it is highly recommended to use the new Databricks Connector unless you have very specific reasons to use the Spark connector! Actually the only reason why I would still use the Spark connector is the support for the On-Premises data gateway in case your Spark or Databricks cluster is hosted in a private VNet.

So currently the generic Spark connector still looks superior simply for the support in the Power BI Service. However, I am quite sure that it will be fully supported also by the Power BI Service in the near future. I will update this post accordingly!
On the other hand, Azure Active Directory authentication is a huge plus for the native Azure Databricks connector as you do not have to mess around with Databricks Personal Access Tokens (PAT) anymore!

Another thing that I have not yet tested but would be very interesting is whether Pass-Through security works with this new connector. So you log in with your AAD credentials in Power BI, they get passed on to Databricks and from there to the Data Lake Store. For Databricks Table Access Control I assume this will just work as it does for PAT as it is not related to AAD authentication.