Using Power BI Field Parameters to translate Data and Values

When building an enterprise reporting solution with Power BI, a question that always comes up is how to handle translations. Large enterprises operate in various countries where people also speak different languages. So a report should be available in all frequently used languages. Ideally, you just create a report once and then a user can decide (or it is decided for him) in which language the report is displayed.

Power BI only partially supports this scenario and the closest we could get *before field parameters* were introduced is already very well described by Chris Webb’s blog post on Implementing Data (As Well As Metadata) Translations In Power BI – a must-read if you need to deal with translations in Power BI. Another good read on the topic is the blog post Multilingual Reports in Power BI from PBI Guy.

As you will quickly realize, the translation of metadata is already pretty easy as it is baked into the engine. Unfortunately this is not the case when you need to translate actual data values (e.g. product names, …). In the multidimensional version of Analysis Services this just worked like a charm as it was also a native feature but this feature never made it to Analysis Services Tabular Models, Azure Analysis Services or Power BI.

The current approaches when it comes to data and value translations are more workarounds than actual solutions. They probably work fine for small data models and very specific use-cases but usually fall short in performance, usability or maintainability when implemented on a larger scale enterprise models.

The recently introduced Field Parameters in Power BI give us a bit more flexibility here and another potential solution to implement data and value translations in Power BI.

Here is what we want to achieve:

  • create a single report only
  • support for multiple languages – metadata and column data
  • only minor changes to the existing data model

How can Field Parameters help here?

Field Parameters allow you to select the columns you want to display in your report/visual on-the-fly. Based on the selection, the reporting engine decides which physical column(s) it needs to use in the query it generates and sends to the data model.
So we can create a Field Parameter for the different columns that hold the translated data values and already easily switch the language by changing the selection of our Field Parameter. This is how our Filed Parameter would be defined:

Translated ProductName = {
    ("product name", NAMEOF('DimProduct'[EnglishProductName]), 0, "en-US"),
    ("nom du produit", NAMEOF('DimProduct'[FrenchProductName]), 1, "fr-FR"),
    ("nombre de producto", NAMEOF('DimProduct'[SpanishProductName]), 2, "es-SP")
}

I did this for all the fields for which translated values are actually provided. Usually this is just a very small subset of all the available columns!

Translated MonthOfYear = {
    ("MonthName", NAMEOF('DimDate'[EnglishMonthName]), 0, "en-US"),
    ("mois de l'année", NAMEOF('DimDate'[FrenchMonthName]), 1, "fr-FR"),
    ("mes del año", NAMEOF('DimDate'[SpanishMonthName]), 2, "es-SP")
}

Translated DayOfWeek = {
    ("Day Of Week", NAMEOF('DimDate'[EnglishDayNameOfWeek]), 0, "en-US"),
    ("jour de la semaine", NAMEOF('DimDate'[FrenchDayNameOfWeek]), 1, "fr-FR"),
    ("día de la semana", NAMEOF('DimDate'[SpanishDayNameOfWeek]), 2, "es-SP")
}

As you can see, Field Parameters allow you to translate the metadata (first value) and also to define the column to use for the data values (second value, using NAMEOF() function).

To change all field parameters at once I introduced an additional 4th column that holds the culture/language of the current row which is then linked to another static DAX table that is defined as follows:

Language = DATATABLE("Culture", STRING, {{"en-US"}, {"fr-FR"}, {"es-SP"}})

Then relationships are set up between these tables:
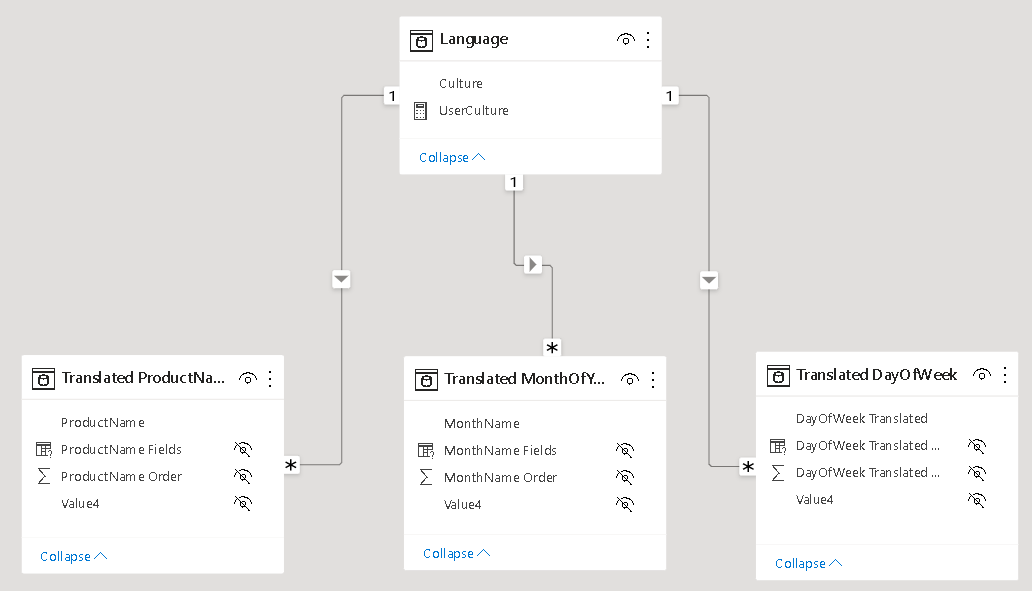
In your report you can now simply use the column from the field parameters and add a slicer for the Language table to control which language is displayed. Note: this must be a single-select slicer as otherwise Power BI will build a hierarchy of the different languages!

Here is the final result:

(please use Full Screen mode from bottom right corner)

As you can see, we just created a single report that supports multiple languages for both, metadata and data values, allows you to easily switch between them and provides similar performance as if you would have built the report for a single language only!

There are still some open questions when it comes to translating all the labels used on the whole report which is already partially covered in the other blog posts referenced above but this approach brings us another step further to a fully translatable report.

Another nice feature of this approach is that you can also put security on top of the Language/Culture table so a user only sees exactly one row – the one with the language/culture of his choice or country. So a user would not even need to select the language but it would be selected for him automatically!
Ideally you could even use the USERCULTURE() DAX function but unfortunately this is currently not supported in the PBI service. There is already an open idea for which you can vote if this is important to you.
USERCULTUER() DAX function is now finally general available also in the service: https://powerbi.microsoft.com/en-us/blog/userculture-dax-function-now-supported-in-power-bi-premium/

The .pbix file can be downloaded here: PBI_Translations.pbix
PowerBI & Big Data – Using pre-calculated Aggregations of Semi- and Non-Additive Measures

Calculating and visualizing semi- and non-additive measures like distinct count in Power BI is usually not a big deal. However, things can become challenging if your data volume grows and exceeds the limits of Power BI!

In one of my recent projects we wanted to visualize data from the customers analytical platform based on Azure Databricks in Power BI. The connection between those two tools works pretty flawless which I also described in my previous post but the challenge was the use-case and the calculations. We wanted to display the distinct customers across various aggregations levels over a billion rows fact table. We came up with different potential solutions all having their pros and cons:

  1. load all data into Power BI (import mode) and do the aggregations there
  2. use Power BI with direct query and let the back-end do the heavy lifting
  3. load only necessary pre-aggregated data into Power BI (import mode)

Please keep in mind that we are dealing with a distinct count measure here. Semi- and Non-additive measure like this cannot easily be aggregated from lower levels to higher levels without having all the detail data available!

Option 1. has the obvious drawback that data model would be huge in size as we were dealing with billions of transactions. This would have exceeded our current size limits for Power BI data models.

Option 2. would usually work fine, but again, for the amount of data we were dealing with the back-end was just no able to provide sub-second latency that was required.

So we went for Option 3. and did the various aggregations on the different levels in Azure Databricks and loaded only the final results to Power BI. First we wanted to use Power BI Aggregations and Composite Models. Unfortunately, this did not work out for us as we were not in control which aggregation table (we had multiple for the different aggregation levels) was used by the engine which potentially resulted in wrong results when additional aggregation was done in Power BI. Also, when slicing for random aggregation levels, Power BI was querying the details in direct query mode causing very poor query performance.

After some further thinking we came up with a new solution which was also based on pre-calculated aggregations but not realized using built-in aggregation tables but having a combined table for all aggregations and some very straight-forward DAX to select the row we wanted! In the end the whole solution consisted of one SQL view using COUNT(DISTINCT xxx) aggregation and GROUP BY GROUPING SETS (T-SQL, Databricks, … supported in all major SQL engines) and a very simple DAX measure!

Here is a little example that illustrates the approach. Assume you want to calculate the distinct customers that bought certain products in a subcategory/category by year. The first step is to create a view that provides this information:

SELECT 
	od.[CalendarYear] AS [Year],
	dp.[ProductSubcategoryKey] AS [ProductSubcategoryKey],
	dp.[ProductCategoryKey] AS [ProductCategoryKey],
	COUNT(DISTINCT CustomerKey) AS [DC_Customers]
FROM [dbo].[FactInternetSales] fis
INNER JOIN [dbo].[vDimProductHierarchy] dp
	ON fis.[ProductKey] = dp.[ProductKey]
INNER JOIN dbo.[DimDate] od
	ON fis.[OrderDatekey] = od.[DateKey]
GROUP BY 
GROUPING SETS (
	(),
	(od.[CalendarYear]),
	(od.[CalendarYear], dp.[ProductSubcategoryKey], dp.[ProductCategoryKey]),
	(od.[CalendarYear], dp.[ProductCategoryKey]),
	(dp.[ProductSubcategoryKey], dp.[ProductCategoryKey]),
	(dp.[ProductCategoryKey])
)

Please note that when we have a natural relationship between hierarchy levels (= only 1:n relationships) we need to specify the current level and also all upper levels to allow a proper drill-down later on! E.g. ProductCategory (1 -> n) ProductSubcategory

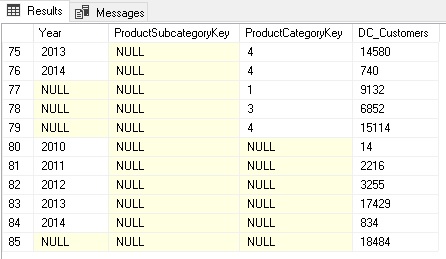
This calculates all the different aggregation levels we need. Columns with NULL mean they were not filtered/grouped by when calculating the aggregation.
Rows 80-84 contain the aggregations grouped by Year only whereas rows 77-79 contain only aggregates by ProductCategoryKey. The rows 75-76 were aggregated by Year AND ProductCategoryKey.
Depending on your final report layout, you may not need all of them and you should consider removing those that are not needed!

This table is then loaded into Power BI. You can either use a custom SQL query like above in Power BI directly or create a view in the back-end system which would be my preferred solution. Alternatively you can also create all these grouping sets using Power Query/M. The incredible Imke Feldmann (t, b) came up with a solution that allows you to specify the grouping sets in a similar way as in SQL and do all this magic within Power BI directly! I hope she will blog about it pretty soon!
(The sample workbook at the end of this post also contains a little preview of this M-magic.)

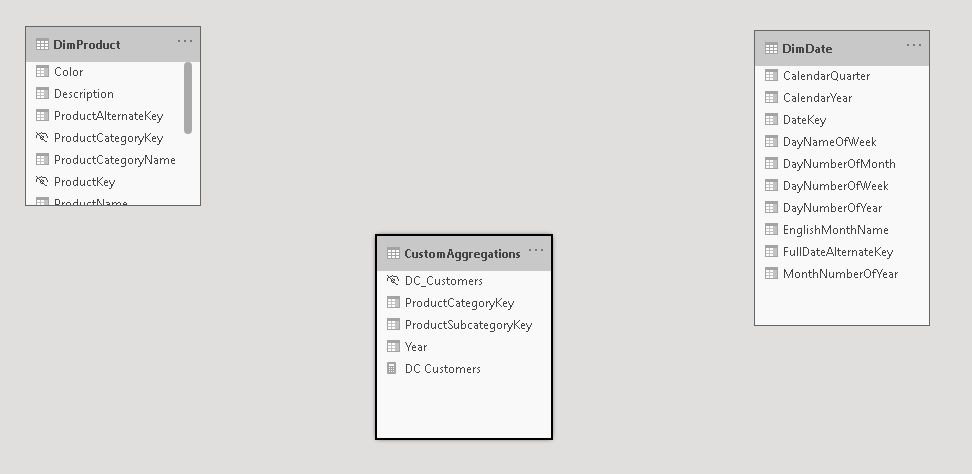
Now that we have all the data we need in Power BI, we need to display the right values for the selections in the report which of course can be dynamic. That’s a bit tricky but once you understand the concept, it is pretty straight forward. First of all, the table containing the aggregations must not be related to any other table as we build them on the fly within our DAX measure. The table itself can also be hidden.

And this is the final DAX for our measure:

DC Customers = 
VAR _sel_SubcategoryKey = SELECTEDVALUE(DimProduct[ProductSubcategoryKey])
VAR _sel_CategoryKey = SELECTEDVALUE(DimProduct[ProductCategoryKey])
VAR _sel_Year = SELECTEDVALUE(DimDate[CalendarYear])
VAR _tbl_Agg = CALCULATETABLE(
    'CustomAggregations',
    TREATAS({_sel_SubcategoryKey}, CustomAggregations[ProductSubcategoryKey]),
    TREATAS({_sel_CategoryKey}, CustomAggregations[ProductCategoryKey]),
    TREATAS({_sel_Year}, CustomAggregations[Year])
)
VAR _AggCount = COUNTROWS(_tbl_Agg)
RETURN
    IF(_AggCount = 1, MAXX(_tbl_Agg, [DC_Customers]), _AggCount * -1)

The first part is to get all the selected values of the lookup/dimension tables the user selects on the report. These are all the _sel_XXX variables. SELECTEDVALUE() returns the selected value if only one item is in the current filter context and BLANK()/NULL otherwise. We then use TREATAS() to apply those filters (either a single item or NULL) to our aggregations table. This should usually only return a table with a single row so we can use MAXX() to get our actual value from that one row. I also added a check in case multiple rows are returned which can potentially happen if you use multi-selects in your filters and instead of showing wrong values I’d rather indicate that there is something wrong with the calculation.

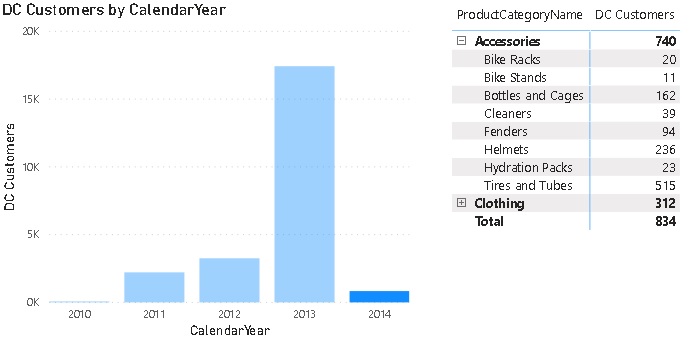
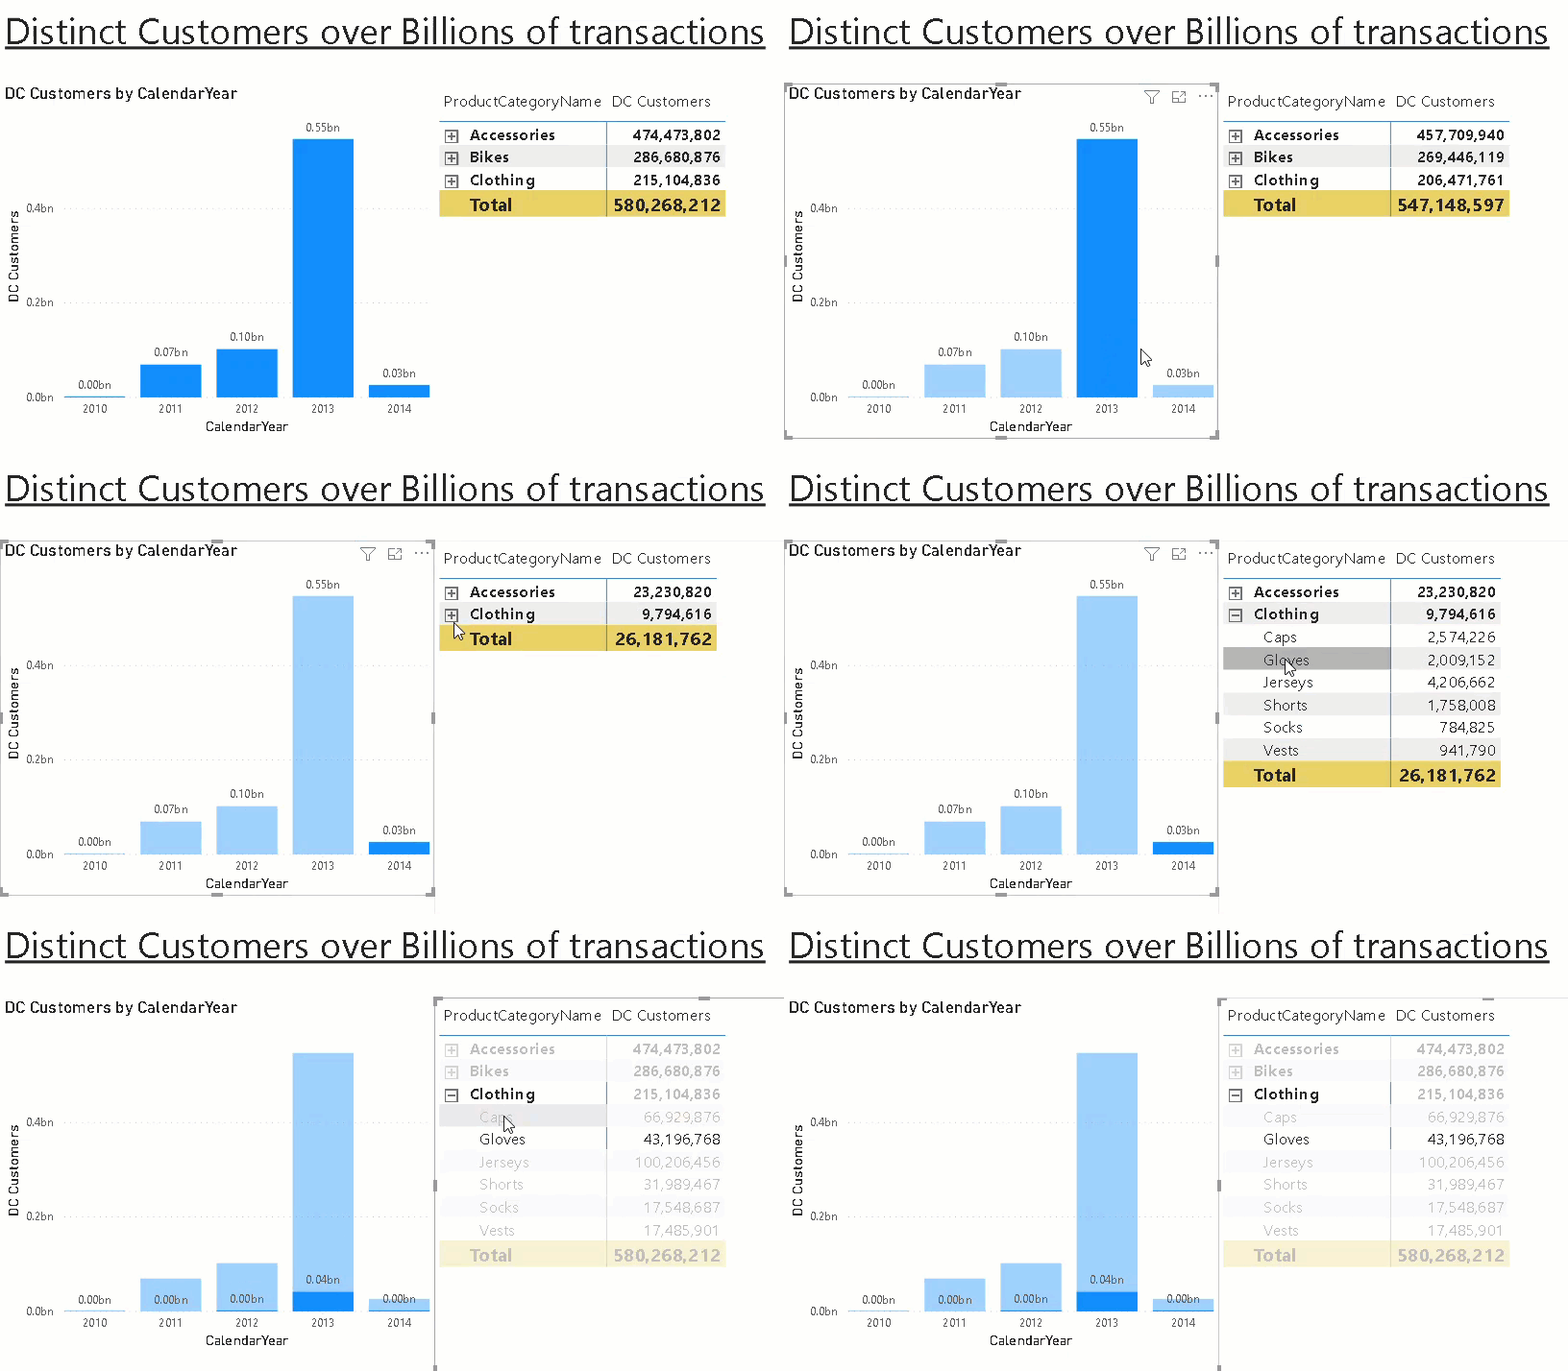
The measure can then be sliced and diced by our pre-defined aggregation levels as if it would be a regular measure but instead of having to process those expensive calculations on the fly we use the pre-calculated aggregates!

One thing to be aware of is that it will produce wrong results if multiple items for any of the aggregation levels are selected so it is highly recommended to set all slicers/filters to single select only or ensure that the filtered aggregation levels are also used in the chart. In this case only the grand total will show wrong values or NULL then.
This could also be fixed in the DAX measure by checking how many rows are actually selected for each level and throw an error in case it is used in a filter and the count of values is > 1.

I did some further thinking and this approach could probably also be used to mimic custom roll-ups and unary operators we know from Analysis Services Multidimensional cubes. If I find some proper examples and this turns out to be feasibly I will write another blog post about it!

Download: Custom_Aggregations_NonAdditive_Measure.pbix

Power BI – Dynamic TopN + Others with Drill-Down

A very common requirement in reporting is to show the Top N items (products, regions, customers, …) and this can also be achieved in Power BI quite easily.

But lets start from the beginning and show how this requirement usually evolves and how to solve the different stages.

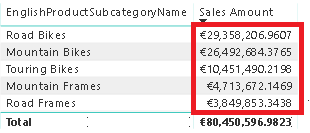
The easiest thing to do is to simply resize the visual (e.g. table visual) to only who 5 rows and sort them descending by your measure:

This is very straight forward and I do not think it needs any further explanation.

The next requirement that usually comes up next is that the customer wants to control, how many Top items to show. So they implement a slicer and make the whole calculation dynamic as described here:
SQL BI – Use of RANKX in a Power BI measure
FourMoo – Dynamic TopN made easy with What-If Parameter

Again, this works pretty well and is explained in detail in the blog posts.

Once you have implemented this change the business users usually complain that Total is wrong. This depends on how you implemented the TopN measure and what the users actually expect. I have seen two scenarios that cause confusion:
1) The Total is the SUM of the TopN items only – not reflecting the actual Grand Total
2) The Total is NOT the SUM of the TopN items only – people complaining that Power BI does not sum up correctly

As I said, this pretty much depends on the business requirements and after discussing that in length with the users, the solution is usually to simply add an “Others” row that sums up all values which are not part of the TopN items. For regular business users this requirement sounds really trivial because in Excel the could just add a new row and subtract the values of the TopN items from the Grand Total.

However, they usually will not understand the complexity behind this requirement for Power BI. In Power BI we cannot simply add a new “Others” row on the fly. It has to be part of the data model and as the TopN calculations is already dynamic, also the calculation for “Others” has to be dynamic. As you probably expected, also this has been covered already:
Oraylis – Show TopN and rest in Power BI
Power BI community – Dynamic Top N and Others category

These work fine even if I do not like the DAX as it is unnecessarily complex (from my point of view) but the general approach is the same as the one that will I show in this blog post and follows these steps:
1) create a new table in the data model (either with Power Query or DAX) that contains all our items that we want to use in our TopN calculation and an additional row for “Others”
2) link the new table also to the fact table, similar to the original table that contains your items
3) write a measure that calculates the rank for each item, filters the TopN items and assigns the rest to the “Others” item
4) use the new measure in combination with the new table/column in your visual

Step 1 – Create table with “Others” row

I used a DAX calculated table that does a UNION() of the existing rows for the TopN calculation and a static row for “Others”. I used ROW() first so I can specify the new column names directly. I further use ALLNOBLANKROW() to remove to get rid of any blank rows.

Subcategory_wOthers = UNION(
ROW("SubcategoryKey_wOthers", -99, "SubcategoryName_wOthers", "Others"), 
ALLNOBLANKROW('ProductSubcategory'[ProductSubcategoryKey], 'ProductSubcategory'[SubcategoryName])
) 

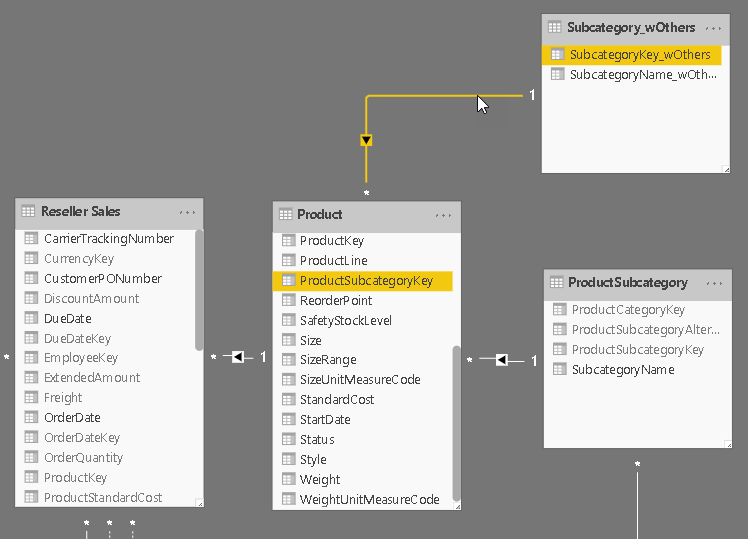
Step 2 – Create Relationship

The new table is linked to the same table to which the original table was linked to. This can be the fact-table directly or an intermediate table that then filters the facts in a second step (as shown below)

Step 3 – Create DAX measure

That’s actually the tricky part about this solution, but I think the code is still very easy to read and understand:

Top Measure ProductSubCategory =  
/* get the items for which we want to calculate TopN + Others */ 
VAR Items = SELECTCOLUMNS(ALL(Subcategory_wOthers), "RankItem", Subcategory_wOthers[SubcategoryName_wOthers]) 
/* add a measure that we use for ranking */ 
VAR ItemsWithValue = ADDCOLUMNS(Items, "RankMeasure", CALCULATE([Selected Measure], ALL(ProductSubcategory))) 
/* add a column with the rank of the measure within the items */ 
VAR ItemsWithRank = ADDCOLUMNS(ItemsWithValue, "Rank", RANKX(ItemsWithValue, [RankMeasure], [RankMeasure], DESC, Dense)) 
/* calculate whether the item is a Top-item or belongs to Others */ 
VAR ItemsWithTop = ADDCOLUMNS(ItemsWithRank, "TopOrOthers", IF([Rank] <= [Selected TopN], [RankItem], "Others")) 
/* select the final items for which the value is calculated */ 
VAR ItemsFinal = SELECTCOLUMNS( /* we only select a single column to be used with TREATAS() in the final filter */
     FILTER(
         ItemsWithTop, 
         CONTAINSROW(VALUES(Subcategory_wOthers[SubcategoryName_wOthers]), [TopOrOthers]) /* need to obey current filters on _wOthers table. e.g. after Drill-Down */
         && CONTAINSROW(VALUES(ProductSubcategory[SubcategoryName]), [RankItem])), /* need to obey current filters on base table */ 
     "TopN_Others", [RankItem]) 
RETURN      
CALCULATE(
    [Selected Measure], 
    TREATAS(ItemsFinal, Subcategory_wOthers[SubcategoryName_wOthers])
)

Step 4 – Build Visual

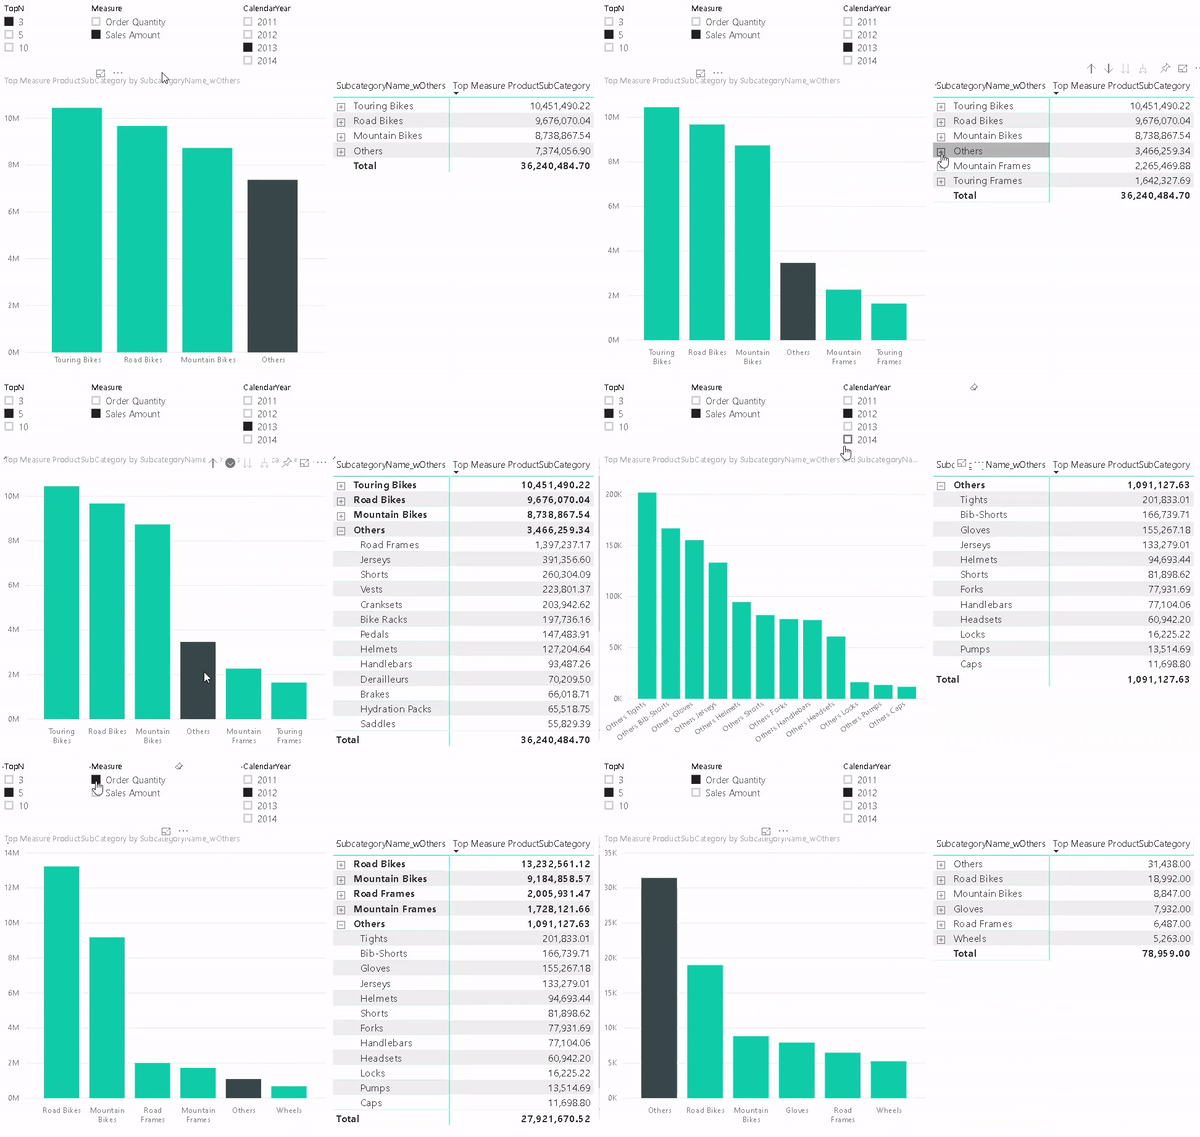
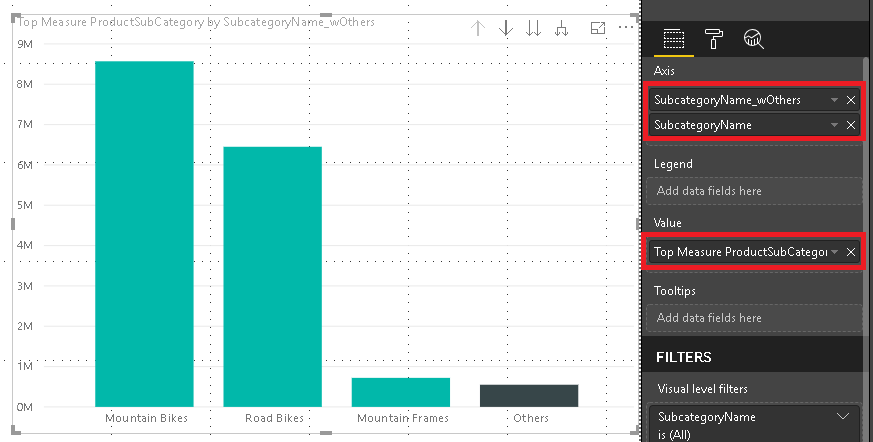
One of the benefits of this approach is that it also allows you to use the “Others” value in slicers, for cross-filtering/-highlight and even in drill-downs. To do so we need to configure our visual with two levels. The first one is the column that contains the “Others” item and the second level is the original column that contains the items. The DAX measure will take care of the rest.

And that’s it! You can now use the column that contains the artificial “Others” in combination with the new measure wherever you like. In a slicer, in a chart or in a table/matrix!

The final PBIX workbook can also be downloaded: TopN_Others.pbix

Visualizing SSAS Calculation Dependencies using PowerBI


UPDATE: This does not work for Tabular Models in Compatibility Level 120 or above as they do not expose the calculation dependencies anymore!


One of my best practices when designing bigger SQL Server Analysis Services (SSAS) Tabular models is to nest calculations whenever possible. The reasons for this should be quite obvious:

  • no duplication of logics
  • easier to develop and maintain
  • (caching)

However, this also comes with a slight drawback: after having created multiple layers of nested calculations it can be quite hart to tell on which measures a top-level calculations actually depends on. Fortunately the SSAS engine exposes this calculation dependencies in one of its DMVs – DISCOVER_CALC_DEPENDENCY.
This DMV basically contains information about all calculations in the model:

  • Calculated Measures
  • Calculated Columns
  • Relationships
  • Dependencies to Tables/Columns

Chris Webb already blogged about this DMV some time ago and showed some basic (tabular) visualization within an Excel Pivot table (here). My post focuses on PowerBI and how can make the content of this DMV much more appealing and visualize it in a way that is very easy to understand.
As the DMV is built up like a parent-child hierarchy, I had to use a recursive M-function to resolve this self-referencing table which actually was the hardest part to do. Each row contains a link to a dependent object, which can have other dependencies again. In order to visualize this properly and let the user select a Calculation of his choice to see a calculation tree, I needed to expand each row with all of its dependencies, keeping their link to the root-node:

Here is a little example:

Object Referenced_Object
A B
B C

The table above is resolved to this table:

Root Object Referenced_Object
A A B
A B C
B B C

The Root-column is then used to filter and get all dependent calculations.
The PowerBI file also contains some other M-functions but those are mainly for ease-of-use and to keep the queries simple.

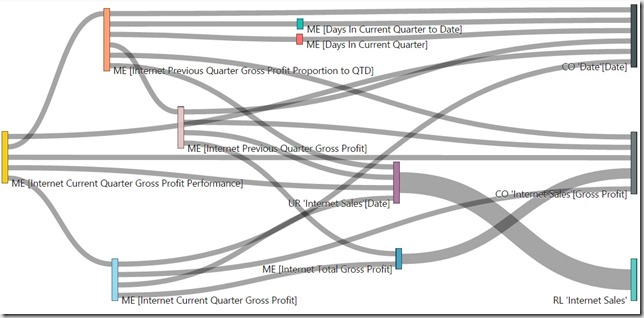
Once all the data was loaded into the model, I could use one of PowerBI’s custom visuals from the PowerBI Gallery – the Sankey Chart with Labels
SSAS_Visualizing_Tabular_Calc_Dependencies

Here is also an interactive version using the Publishing Feature of Power BI:


You can use the Slicers to filter on the Table, the Calculation Type and the Calculation itself and the visual shows all the dependencies down to the physical objects being Tables and Columns. This makes it a lot easier to understand your model and the dependencies that you built up over time.
I attached the sample-PowerBI-file below. You simply need to change the connectionstring to your SSAS Tabular Server and refresh the data connections.

The PowerBI-file (*.pbix) can be downloaded here: SSAS_CalcDependencies.pbix

Calculating Pearson Correlation Coefficient using DAX

The original request for this calculation came from one of my blog readers who dropped me a mail asking if it possible to calculated the Pearson Correlation Coefficient (PCC or PPMCC) in his PowerPivot model. In case you wonder what the Pearson Correlation Coefficient is and how it can be calculated – as I did in the beginning –  these links What is PCC, How to calculate PCC are very helpful and also offer some examples and videos explaining everything you need to know about it. I highly recommend to read the articles before you proceed here as I will not go into the mathematical details of the calculation again in this blog which is dedicated to the DAX implementation of the PCC.

UPDATE 2017-06-04:
Daniil Maslyuk posted an updated version of the final calculation using DAX 2.0 which is much more readable as it is using variables instead of separate measures for every intermediate step. His blog post can be found at https://xxlbi.com/blog/pearson-correlation-coefficient-in-dax/

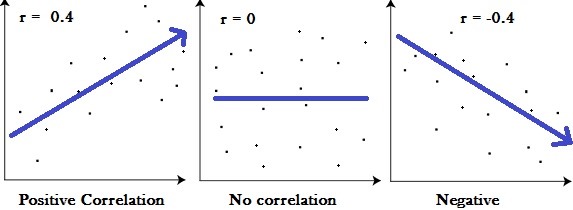
Anyway, as I know your time is precious, I will try to sum up its purpose for you: “The Pearson Correlation Coefficient calculates the correlation between two variables over a given set of items. The result is a number between -1 and 1. A value higher than 0.5 (or lower than –0.5) indicate a strong relationship whereas numbers towards 0 imply weak to no relationship.”

The two values we want to correlate are our axes, whereas the single dots represent our set of items. The PCC calculates the trend within this chart represented as an arrow above.

The mathematical formula that defines the Pearson Correlation Coefficient is the following:

The PCC can be used to calculate the correlation between two measures which can be associated with the same customer. A measure can be anything here, the age of a customer, it’s sales, the number of visits, etc. but also things like sales with red products vs. sales with blue products. As you can imagine, this can be a very powerful statistical KPI for any analytical data model. To demonstrate the calculation we will try to correlate the order quantity of a customer with it’s sales amount. The order quantity will be our [MeasureX] and the sales will be our [MeasureY], and the set that we will calculate the PCC over are our customers. To make the whole calculation more I split it up into separate measures:

  1. MeasureX := SUM(‘Internet Sales’[Order Quantity])
  2. MeasureY := SUM(‘Internet Sales’[Sales Amount])

Based on these measures we can define further measures which are necessary for the calculation of our PCC. The calculations are tied to a set if items, in our case the single customers:

  1. Sum_XY := SUMX(VALUES(Customer[Customer Id]), [MeasureX] * [MeasureY])
  2. Sum_X2 := SUMX(VALUES(Customer[Customer Id]), [MeasureX] * [MeasureX])
  3. Sum_Y2 := SUMX(VALUES(Customer[Customer Id]), [MeasureY] * [MeasureY])
  4. Count_Items := DISTINCTCOUNT(Customer[Customer Id])

Now that we have calculated the various summations over our base measures, it is time to create the numerator and denominator for our final calculation:

  1. Pearson_Numerator :=
  2.     ([Count_Items] * [Sum_XY]) – ([MeasureX] * [MeasureY])
  3. Pearson_Denominator_X :=
  4.     ([Count_Items] * [Sum_X2]) – ([MeasureX] * [MeasureX])
  5. Pearson_Denominator_Y :=
  6.     ([Count_Items] * [Sum_Y2]) – ([MeasureY] * [MeasureY])
  7. Pearson_Denominator :=
  8.     SQRT([Pearson_Denominator_X] * [Pearson_Denominator_Y])

Having these helper-measures in place the final calculation for our PCC is straight forward:

  1. Pearson := DIVIDE([Pearson_Numerator], [Pearson_Denominator])

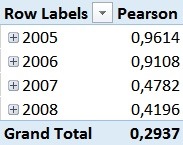
This [Pearson]-measure can then be used together with any attribute in our model – e.g. the Calendar Year in order to track the changes of the Pearson Correlation Coefficient over years:

Pearson by Year

For those of you who are familiar with the Adventure Works sample DB, this numbers should not be surprising. In 2005 and 2006 the Adventure Works company only sold bikes and usually a customer only buys one bike – so we have a pretty strong correlation here. However, in 2007 they also started selling Clothing and Accessories which are in general cheaper than Bikes but are sold more often.

Pearson by Year and Category

This has impact on our Pearson-value which is very obvious in the screenshots above.

As you probably also realized, the Grand Total of our Pearson calculation cannot be directly related to the single years and may also be the complete opposite of the single values. This effect is called Simpson’s Paradox and is the expected behavior here.

[MeasuresX] and [MeasureY] can be exchanged by any other DAX measures which makes this calculation really powerful. Also, the set of items over which we want to calculated the correlation can be exchanged quite easily. Below you can download the sample Excel workbook but also a DAX query which could be used in Reporting Services or any other tool that allows execution of DAX queries.

Sample Workbook (Excel 2013): Pearson.xlsx
DAX Query: Pearson_SSRS.dax

Recursive Calculations in PowerPivot using DAX

If you have ever tried to implement a recursive calculations in DAX similar to how you would have done it back in the good old days of MDX (see here) you would probably have come up with a DAX formula similar to the one below:

  1. Sales ForeCast :=
  2. IF (
  3.     NOT ( ISBLANK ( [Sales] ) ),
  4.     [Sales],
  5.     CALCULATE (
  6.         [Sales ForeCast],
  7.         DATEADD ( 'Date'[Calendar], 1, MONTH )
  8.     ) * 1.05
  9. )

However, in DAX you would end up with the following error:

A circular dependency was detected: ‘Sales'[Sales ForeCast],’Sales'[Sales ForeCast].

This makes sense as you cannot reference a variable within its own definition – e.g. X = X + 1 cannot be defined from a mathematical point of view (at least according to my limited math skills). MDX is somehow special here where the SSAS engine takes care of this recursion by taking the IF() into account.

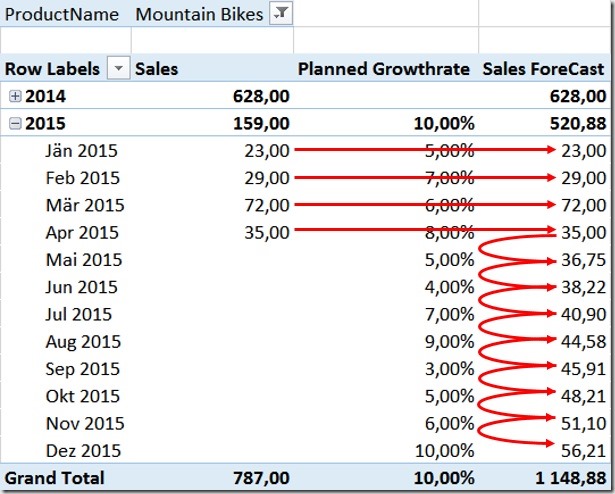
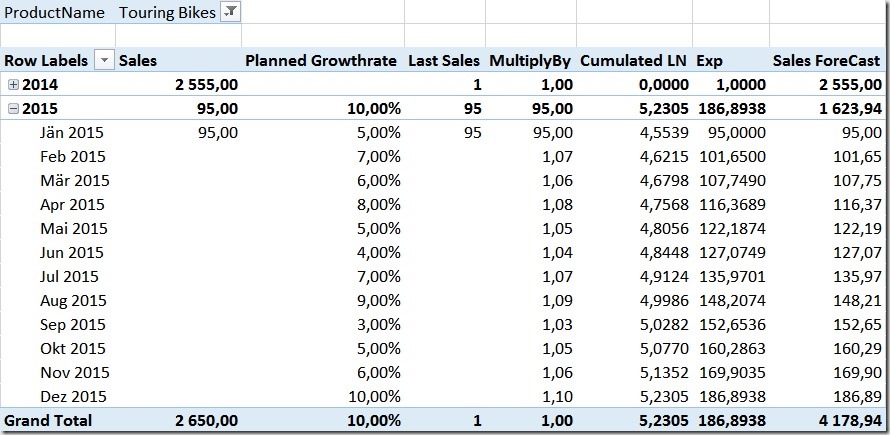
So where could you possible need a recursive calculation like this? In my example I will do some very basic forecasting based on monthly growth rates. I have a table with my actual sales and another table for my expected monthly growth as percentages. If I do not have any actual sales I want to use my expected monthly growth to calculate my forecast starting with my last actual sales:

GeneralLogic

This is a very common requirement for finance applications, its is very easy to achieve in pure Excel but very though to do in DAX as you probably realized on your own what finally led you here Smile

In Excel we would simply add a calculation like this and propagate it down to all rows:
ExcelFormula
(assuming column C contains your Sales, D your Planned Growth Rate and M is the column where the formula itself resides)

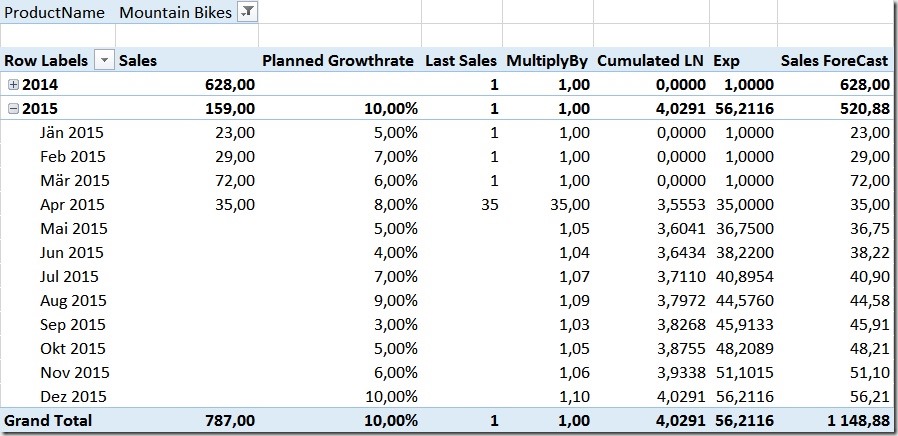
In order to solve this in DAX we have to completely rewrite our calculation! The general approach that we are going to use was already explained by Mosha Pasumansky some years back, but for MDX. So I adopted the logic and changed it accordingly to also work with DAX. I split down the solution into several steps:
1) find the last actual sales – April 2015 with a value of 35
2) find out with which value we have to multiply our previous months value to get the current month’s Forecast
3) calculate the natural logarithm (DAX LN()-function) of the value in step 2)
4) Sum all values from the beginning of time until the current month
5) Raise our sum-value from step 4) to the power of [e] using DAX EXP()-function
6) do some cosmetic and display our new value if no actual sales exist and take care of aggregation into higher levels

Note: The new Office 2016 Preview introduces a couple of new DAX functions, including PRODUCTX() which can be used to combine the Steps 3) to 5) into one simple formula without using any complex LN() and EXP() combinations.

Step 1:
We can use this formula to get our last sales:

  1. Last Sales :=
  2. IF (
  3.     ISBLANK (
  4.         CALCULATE (
  5.             [Sales],
  6.             DATEADD ( 'Date'[DateValue], 1, MONTH )
  7.         )
  8.     ),
  9.     [Sales],
  10.     1
  11. )

It basically checks if there are no [Sales] next month. If yes, we use the current [Sales]-value as our [Last Sales], otherwise we use a fixed value of 1 as a multiplication with 1 has no impact on the final result.

Step 2:
Get our multiplier for each month:

  1. MultiplyBy :=
  2. IF (
  3.     ISBLANK ( [Last Sales] ),
  4.     1 + [Planned GrowthRate],
  5.     [Last Sales]
  6. )

If we do not have any [Last Sales], we use our [Planned GrowthRate] to for our later multiplication/summation, otherwise take our [Last Sales]-value.

Step 3 and 4:
As we cannot use “Multiply” as our aggregation we first need to calculate the LN and sum it up from the first month to the current month:

  1. Cumulated LN :=
  2. CALCULATE (
  3.     SUMX ( VALUES ( 'Date'[Month] ), LN ( [MultiplyBy] ) ),
  4.     DATESBETWEEN (
  5.         'Date'[DateValue],
  6.         BLANK (),
  7.         MAX ( 'Date'[DateValue] )
  8.     )
  9. )


Step 5 and 6:
If there are no actual sales, we display our calculated Forecast:

  1. Sales ForeCast :=
  2. SUMX (
  3.     VALUES ( 'Date'[Month] ),
  4.     IF ( ISBLANK ( [Sales] ), EXP ( [Cumulated LN] ), [Sales] )
  5. )

Note that we need to use SUMX over our Months here in order to also get correct subtotals on higher levels, e.g. Years. That’s all the SUMX is necessary for, the IF itself should be self-explaining here.


So here is the final result – check out the last column:
FinalPivot

The calculation is flexible enough to handle missing sales. So if for example we would only have sales for January, our recursion would start there and use the [Planned GrowthRate] already to calculate the February Forecast-value:
FinalPivot2

Quite handy, isn’t it?

The sample-workbook (Excel 365) can be downloaded here: RecursiveCalculations.xlsx

Dynamic ABC Analysis in Power Pivot using DAX – Part 2

Almost two years ago I published the first version of an Dynamic ABC Analysis in Power Pivot and by now it is the post with the most comments among all my blog posts. This has two reason:
1) the formula was quite complex and not easy to understand or implement
2) the performance was not really great with bigger datasets

When the first of those comments flew in, I started investigating into a new, advanced formula. At about the same time Marco Russo and Alberto Ferrari published their ABC Classification pattern – a static version using calculated columns – at www.daxpatterns.com. When I had my first dynamic version ready I sent it to Marco and Alberto and asked if they are interested in the pattern and if I can publish it on their website. Long story short – this week the new pattern was released and can now be found here:

ABC Classification – Dynamic

It got some major performance improvements and was also designed towards reusability with other models. The article also contains some detailed explanations how the formula actually works but its still very hard DAX which will take some time to be fully understood. The pattern also features some extended versions to address more specific requirements but I think its best to just read the article on your own.

Hope you enjoy it!

Events-In-Progress for Time Periods in DAX

Calculating the Events-In-Progress is a very common requirement and many of my fellow bloggers like Chris Webb, Alberto Ferrari and Jason Thomas already blogged about it and came up with some really nice solutions. Alberto also wrote a white-paper summing up all their findings which is a must-read for every DAX and Tabular/PowerPivot developer.
However, I recently had a slightly different requirement where I needed to calculate the Events-In-Progress for Time Periods – e.g. the Open Orders in a given month – and not only for a single day. The calculations shown in the white-paper only work for a single day so I had to come up with my own calculation to deal with this particular problem.

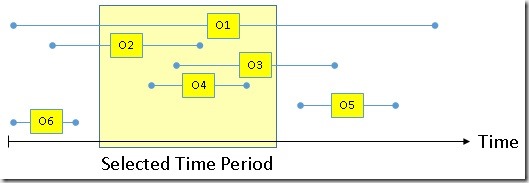
Before we can start we need to identify which orders we actually want to count if a Time Period is selected. Basically we have to differentiate between 6 types of Orders for our calculation and which of them we want to filter or not:
Overview_EventsInProgress_TimeFrame

Order Definition
Order1 (O1) Starts before the Time Period and ends after it
Order2 (O2) Starts before the Time Period and ends in it
Order3 (O3) Starts in the Time Period and ends after it
Order4 (O4) Starts and ends in the Time Period
Order5 (O5) Starts and ends after the Time Period
Order6 (O6) Starts and ends before the Time Period

For my customer an order was considered as “open” if it was open within the selected Time Period, so in our case we need to count only Orders O1, O2, O3 and O4. The first calculation you would usually come up with may look like this:

  1. [MyOpenOrders_FILTER] :=
  2. CALCULATE (
  3.     DISTINCTCOUNT ( ‘Internet Sales’[Sales Order Number] ),
  4.     FILTER (
  5.         ‘Internet Sales’,
  6.         ‘Internet Sales’[Order Date]
  7.             <= CALCULATE ( MAX ( ‘Date’[Date] ) )
  8.     ),
  9.     FILTER (
  10.         ‘Internet Sales’,
  11.         ‘Internet Sales’[Ship Date]
  12.             >= CALCULATE ( MIN ( ‘Date’[Date] ) )
  13.     )
  14. )
[MyOpenOrders_FILTER] :=
CALCULATE (
    DISTINCTCOUNT ( 'Internet Sales'[Sales Order Number] ), -- our calculation, could also be a reference to measure
    FILTER (
        ‘Internet Sales’,
        ‘Internet Sales’[Order Date]
            <= CALCULATE ( MAX ( 'Date'[Date] ) )
    ),
    FILTER (
        ‘Internet Sales’,
        ‘Internet Sales’[Ship Date]
            >= CALCULATE ( MIN ( 'Date'[Date] ) )
    )
)

We apply custom filters here to get all orders that were ordered on or before the last day and were also shipped on or after the first day of the selected Time Period. This is pretty straight forward and works just fine from a business point of view. However, performance could be much better as you probably already guessed if you read Alberto’s white-paper.

So I integrate his logic into my calculation and came up with this formula (Note that I could not use the final Yoda-Solution as I am using a DISTINCTCOUNT here):

  1. [MyOpenOrders_TimePeriod] :=
  2. CALCULATE (
  3.     DISTINCTCOUNT ( ‘Internet Sales’[Sales Order Number] ),
  4.     GENERATE (
  5.         VALUES ( ‘Date’[Date] ),
  6.         FILTER (
  7.             ‘Internet Sales’,
  8.             CONTAINS (
  9.                 DATESBETWEEN (
  10.                     ‘Date’[Date],
  11.                     ‘Internet Sales’[Order Date],
  12.                     ‘Internet Sales’[Ship Date]
  13.                 ),
  14.                 [Date], ‘Date’[Date]
  15.             )
  16.         )
  17.     )
  18. )

To better understand the calculation you may want to rephrase the original requirement to this: “An open order is an order that was open on at least one day in the selected Time Period”.

I am not going to explain the calculations in detail again as the approach was already very well explained by Alberto and the concepts are the very same.

An alternative calculation would also be this one which of course produces the same results but performs “different”:

  1. [MyOpenOrders_TimePeriod2] :=
  2. CALCULATE (
  3.     DISTINCTCOUNT ( ‘Internet Sales’[Sales Order Number] ),
  4.     FILTER (
  5.         GENERATE (
  6.             SUMMARIZE (
  7.                 ‘Internet Sales’,
  8.                 ‘Internet Sales’[Order Date],
  9.                 ‘Internet Sales’[Ship Date]
  10.             ),
  11.             DATESBETWEEN (
  12.                 ‘Date’[Date],
  13.                 ‘Internet Sales’[Order Date],
  14.                 ‘Internet Sales’[Ship Date]
  15.             )
  16.         ),
  17.         CONTAINS ( VALUES ( ‘Date’[Date] ), [Date], ‘Date’[Date] )
  18.     )
  19. )

I said it performs “different” as for all DAX calculations, performance also depends on your model, the data and the distribution and granularity of the data. So you should test which calculation performs best in your scenario. I did a simple comparison in terms of query performance for AdventureWorks and also my customer’s model and results are slightly different:

Calculation (Results in ms)   AdventureWorks   Customer’s Model
[MyOpenOrders_FILTER]                   58.0              1,094.0
[MyOpenOrders_TimePeriod]                   40.0                  390.8
[MyOpenOrders_TimePeriod2]                   35.5                  448.3

As you can see, the original FILTER-calculation performs worst on both models. The last calculation performs better on the small AdventureWorks-Model whereas on my customer’s model (16 Mio rows) the calculation in the middle performs best. So it’s up to you (and your model) which calculation you should prefer.

The neat thing is that all three calculations can be used with any existing hierarchy or column in your Date-table and of course also on the Date-Level as the original calculation.

Download: Events-in-Progress.pbix

Applied Basket Analysis in Power Pivot using DAX

Basket Analysis is a very common analysis especially for online shops. Most online shops make use of it to make you buy products that “Others also bought …”. Whenever you view a specific product “Product A” from the online shop, basket analysis allows the shop to show you further products that other customers bought together with “Product A”. Its basically like taking a look into other customers shopping baskets. In this blog post I will show how this can be done using Power Pivot. Alberto Ferrari already blogged about it here some time ago and showed a solution for Power Pivot v1. There is also dedicated chapter in the whitepaper The Many-to-Many Revolution 2.0 which deals with Basket Analysis, already in Power Pivot v2. Power Pivot v2 already made the formula much more readable and also much faster in terms of performance. Though, there are still some things that I would like to add.

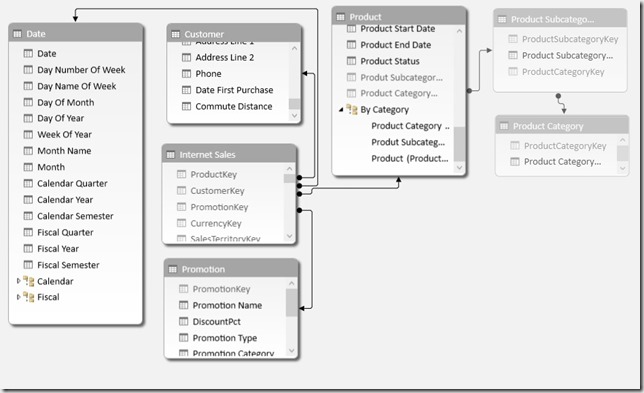
Lets take a look at the initial data model first:Model_Old

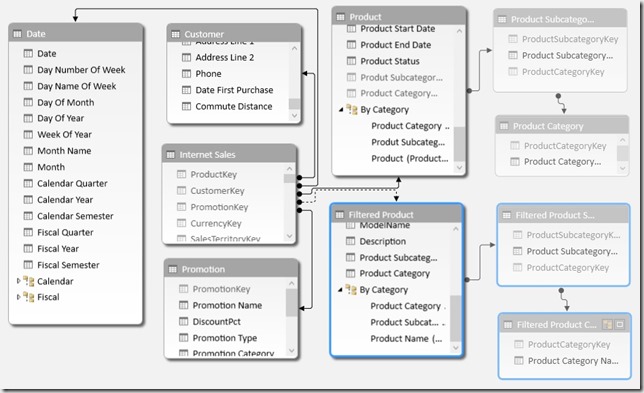
First of all we do not want to modify this model but just extend it so that all previously created measures, calculations and, most important, the reports still work. So the only thing we do is to add our Product-tables again but with a different name. Note that I also added the Subcategory and Category tables in order to allow Basket Analysis also by the Product-Category hierarchy. As we further do not want to break anything we only use an inactive relationship to our ‘Internet Sales’ fact table.

After adding the tables the model looks as follows:Model_New

The next and actually last thing to do is to add the following calculated measure:

Sold in same Order :=
CALCULATE (
COUNTROWS ( ‘Internet Sales’ ),
CALCULATETABLE (
SUMMARIZE (
‘Internet Sales’,
‘Internet Sales’[Sales Order Number]
),
ALL ( ‘Product’ ),
USERELATIONSHIP ( ‘Internet Sales’[ProductKey], ‘Filtered Product’[ProductKey] )
)
)

(formatted using DAX Formatter)

The inner CALCULATETABLE returns a list/table of all [Sales Order Numbers] where a ‘Filtered Product’ was sold and uses this table to extend the filter on the ‘Internet Sales’ table. It is also important to use ALL(‘Product’) here otherwise we would have two filters on the same column ([ProductKey]) which would always result in an empty table. Doing a COUNTROWS finally returns all for all baskets where the filtered product was sold.
We could also change ‘Internet Sales'[Sales Order Number] to ‘Internet Sales'[CustomerKey] in order to analyze what other customers bought also in different baskets (This was done for Example 3). The whole SUMMARIZE-function could also be replaced by VALUES(‘Internet Sales'[Sales Order Number]). I used SUMMARIZE here as I had better experiences with it in terms of performance in the past, though, this may depend on your data. The calculation itself also works with all kind of columns and hierarchies, regardless whether its from table ‘Product’, ‘Filtered Product’, or any other table!

So what can we finally do with this neat formula?

1) Classic Basket Analysis – “Others also bought …”:
Result_ClassicBasketAnalysis

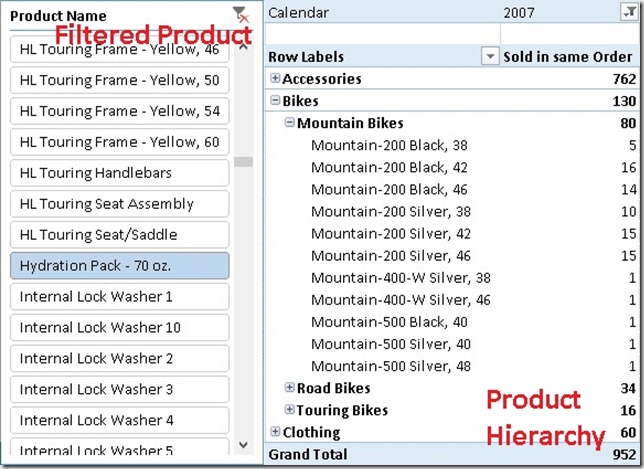
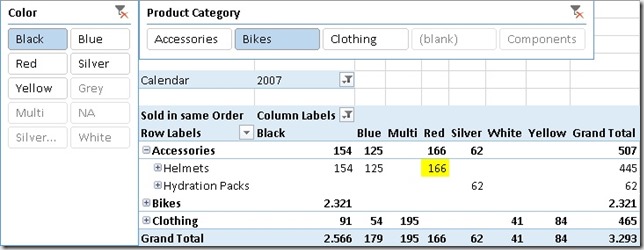
As we can see Hydration Packs are more often sold together with Mountain Bikes opposed to Road Bikes and Touring Bikes. We could also use a slicer on ‘Filtered Product Subcategory’=”Accessories” in order to see how often Accessories are sold together with other products. You may analyze by Color and Product Category:
Result_ByColor
As we can see people that buy black bikes are more likely to buy red helmets than blue helmets.

2) Basket Analysis Matrix:
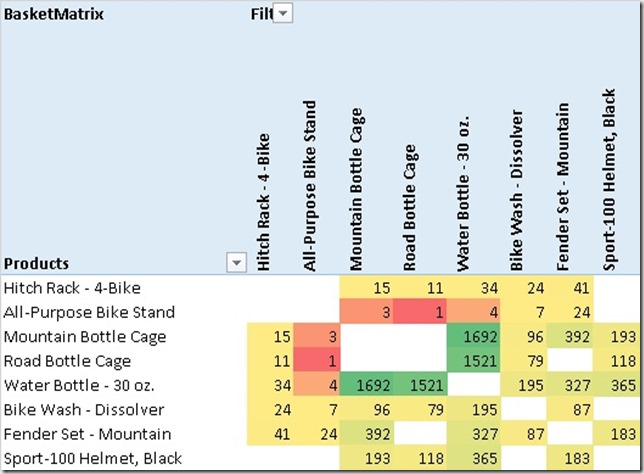
What may also be important for us is which products are sold together the most often? This can be achieved by pulling ‘Product’ on rows and ‘Filtered Product’ on columns. By further applying conditional formatting we can identify correlations pretty easy:
Result_BasketMatrix
Water Bottles are very often sold together with Bottle Cages – well, not really a surprise. Again, you can also use all kind of hierarchies here for your analysis.
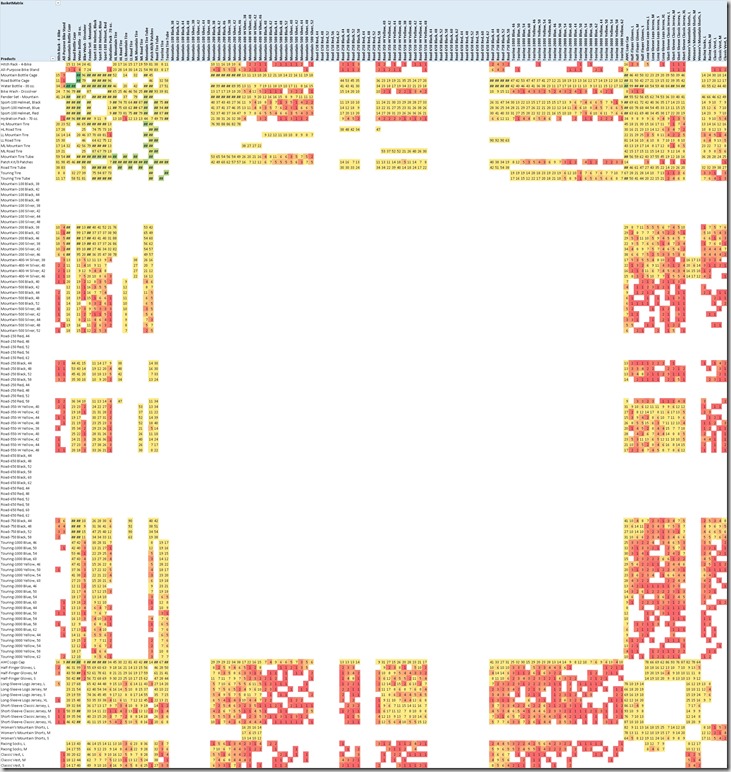
This is what the whole matrix looks like:
Result_BasketMatrixFull
The big blank section in the middle are our Bikes. This tells us that there is no customer that bought two bikes in the same order/basket.

For this analysis I used an extended version of the calculation above to filter out values where ‘Product’ = ‘Filtered Product’ as of course every product is sold within its own basket:

BasketMatrix :=
IF (
MIN ( ‘Product’[ProductKey] )
<> MIN ( ‘Filtered Product’[ProductKey] ),
[Sold in same Order]
)

3) Find Customers that have not bough a common product yet
As we now know from the above analysis which products are very often bought together we can also analyze which customers do not fall in this pattern – e.g. customers who have bough a Water Bottle but have not bought a Bottle Cage yet. Again we can extend our base-calculation to achieve this:

Not Sold to same Customer :=
IF (
NOT ( ISBLANK ( [Sum SA] ) ) && NOT ( [Sold to same Customer] ),
“Not Sold Yet”
)

The first part checks if the selected ‘Product’ was sold to the customer at all and the second part checks if the ‘Filtered Product’ was not sold to the customer yet. In that case we return “Not Sold Yet”, and otherwise  BLANK() which is the default if the third parameter is omitted. That’s the result:
Result_NotSoldToCustomer
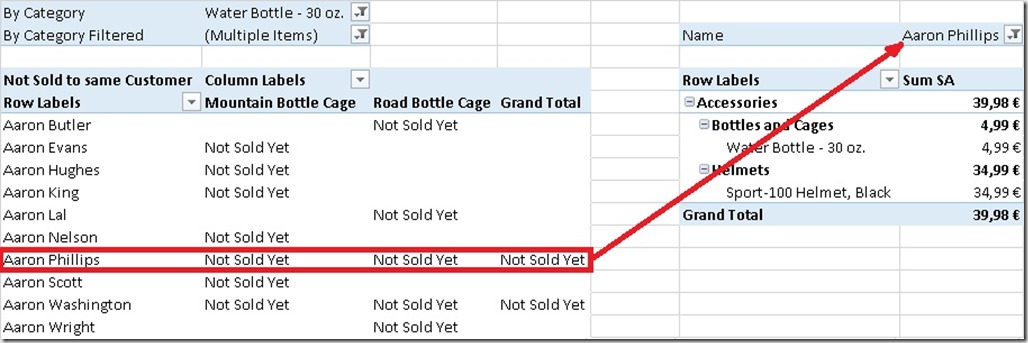
Aaron Phillips has bought a Water Bottle but no Mountain Bottle Cage nor a Road Bottle Cage – maybe we should send him some advertisement material on Bottle Cages? Smile


As you can see there are a lot of analyses possible on top of that little measure that we created originally. All work with any kind of grouping or hierarchy that you may have and no change to your data model is necessary, just a little extension.

And that’s it – Basket Analysis made easy using Power Pivot and DAX!

Downloads:

Sample Excel Workbook with all Examples: BasketAnalysis.xlsx
Sample PowerBI Desktop file with all Examples (DAX only, no Visuals): BasketAnalysis.pbix

Optimizing Columnar Storage for Measures

First of all I have to thank Marco Russo for his blog post on Optimizing High Cardinality Columns in Vertipaq and also his great session at SQL PASS Rally Nordic in Stockholm last year which taught me a lot about columnar storage in general. I highly recommend everyone to read the two mentioned resources before continuing here. Most of the ideas presented in this post are based on these concepts and require at least basic knowledge in columnar storage.

When writing one of my recent posts I ended up with a Power Pivot model with roughly 40M rows. It contained internet logs from Wikipedia, how often someone clicked on a given page per month and how many bytes got downloaded. As you can imagine those values can vary very heavily, especially the amount of bytes downloaded. So in the Power Pivot model we end up having a lot of distinct values in our column that we use for our measure. As you know from Marcos posts, the allocated memory and therefore also the  performance of columnar storage systems is directly related to the number of distinct values in a column – the more the worse. Marco already described an approach to split up a single column with a lot of distinct values into several columns with less distinct values to optimize storage. These concepts can also be used on columns that contain measures or numeric values in general. Splitting numeric values is quite easy, assuming your values range from 1 to 1,000,000 you can split this column into two by dividing the value by 1000 and using MOD 1000 for the second column. Instead of one column with the value 123,456 you end up with two columns with the values 123 and 456. In terms of storage this means that instead of 1,000,000 distinct values we only need to store 2 x 1,000 distinct values. Nothing new so far.

The trick is to combine those columns again at query time to get the original results as before the split. For some aggregations like SUM this is pretty straight forward, others are a bit more tricky. Though, in general the formulas are not really very complex and can be adopted very easily to handle any number of columns:

Aggregation DAX Formula
Value_SUM1 =SUMX(‘1M_Rows_splitted’, [Value_1000] * 1000 + [Value_1])
Value_SUM2 =SUM ( ‘1M_Rows_splitted'[Value_1000] ) * 1000
    + SUM ( ‘1M_Rows_splitted'[Value_1] )
Value_MAX =MAXX(‘1M_Rows_splitted’, [Value_1000] * 1000 + [Value_1])
Value_MIN =MINX(‘1M_Rows_splitted’, [Value_1000] * 1000 + [Value_1])
Value_COUNT =COUNTX(‘1M_Rows_splitted’, [Value_1000] * 1000 + [Value_1])
Value_DISTINCTCOUNT =COUNTROWS (
    SUMMARIZE (
        ‘1M_Rows_splitted’,
        ‘1M_Rows_splitted'[Value_1000],
        ‘1M_Rows_splitted'[Value_1]))

As you can see you can still mimic most kind of aggregation even if the [Value]-column is split up.

Though, don’t exaggerate splitting your columns – too many may be a bit inconvenient to handle and may neglect the effect resulting in worse performance. Marco already showed that you can get a reduction of up to 90% in size, during my simple tests I came up with about the same numbers. Though, it very much depends on the number of distinct values that you actually have in your column!

I would not recommend to always use this approach for all your measure column – no, definitely not! First check how many distinct values your data/measures contain and decide afterwards. For 1 million distinct values it is probably worth it, for 10,000 you may reconsider using this approach. Most important here is to test this pattern with your own data, data model and queries! Test it in terms of size and of course also in terms of performance. It may be faster to split up columns but it may also be slower and it may be also different for each query that you execute against the tabular model / Power Pivot. Again, test with your own data, data model and queries to get representative results! 

Here is a little test that you may run on your own to test this behavior. Simple create the following Power Query using M, load the result into Power Pivot and save the workbook. It basically creates a table with 1 million distinct values (0 to 999,999) and splits this column up into two. You can just copy the workbook, remove the last step “Remove Columns” and save it again to get the “original” workbook and Power Pivot model.

let
    List1 = List.Numbers(0, 1000000),

    TableFromList = Table.FromList(List1, Splitter.SplitByNothing(), null, null, ExtraValues.Error),
    RenamedColumns = Table.RenameColumns(TableFromList,{{"Column1", "Value"}}),
    ChangedType1 = Table.TransformColumnTypes(RenamedColumns,{{"Value", type number}}),
    InsertedCustom = Table.AddColumn(ChangedType1, "Value_1000", each Number.RoundDown([Value] / 1000)),
    InsertedCustom1 = Table.AddColumn(InsertedCustom, "Value_1", each Number.Mod([Value], 1000)),
    ChangedType = Table.TransformColumnTypes(InsertedCustom1,{{"Value_1000", type number}, {"Value_1", type number}}),
    RemovedColumns = Table.RemoveColumns(ChangedType,{"Value"})
in
    RemovedColumns

This is what I ended up with when you compare those two workbooks:

  # distinct values Final Size
single column 1,000,000 14.4 MB
two columns 2 x 1,000 1.4 MB

We also get a reduction in size of 90%! Though, this is a special scenario …
In the real world, taking my previous scenario with the Wikipedia data as an example, I ended up with a reduction to 50%, still very good though. But as you can see the reduction factor varies very much.

Downloads:

Sample workbook with Power Query: 1M_Rows_splitted.xlsx