Azure Data Factory, dynamic JSON and Key Vault references

Paul Andrews (b, t) recently blogged about HOW TO USE ‘SPECIFY DYNAMIC CONTENTS IN JSON FORMAT’ IN AZURE DATA FACTORY LINKED SERVICES. He shows how you can modify the JSON of a given Azure Data Factory linked service and inject parameters into settings which do not support dynamic content in the GUI. What he shows with Linked Services and parameters also applies to Key Vault references – sometimes the GUI allows you to reference a value from the Key Vault instead of hard-coding it but for other settings the GUI only offers a simple text box:
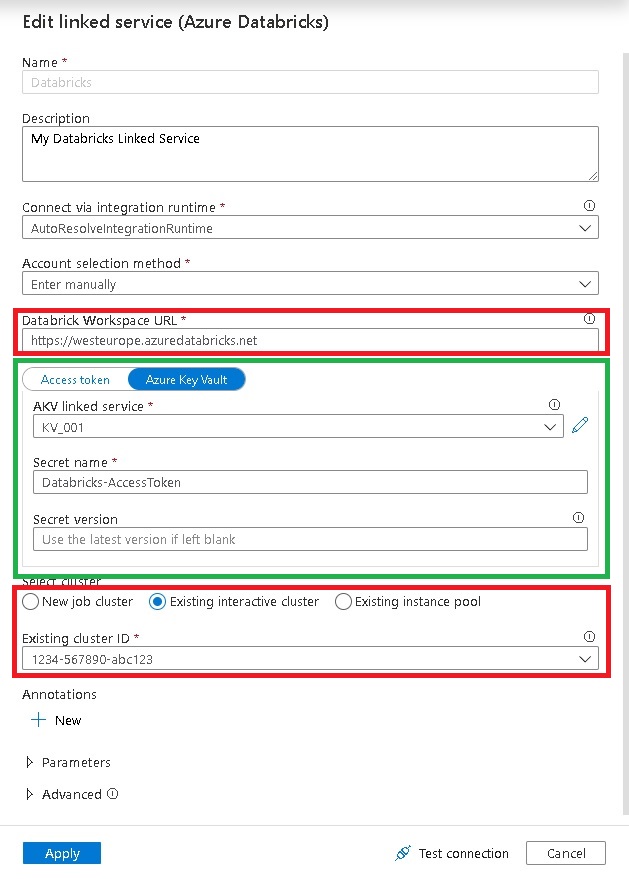
As You can see, the setting “AccessToken” can use a Key Vault reference whereas settings like “Databricks Workspace URL” and “Cluster” do not support them. This is usually fine because the guys at Microsoft also thought about this and support Key Vault references for the settings that are actually security relevant or sensitive. Also, providing the option to use Key Vault references everywhere would flood the GUI. So this is just fine.

But there can be good reasons where you want to get values from the Key Vault also for non-sensitive settings, especially when it comes to CI/CD and multiple environments. From my experience, when you implement a bigger ADF project, you will probably have a Key Vault for your sensitive settings and all other values are provided during the deployment via ARM parameters.

So you will end up with a mix of Key Vault references and ARM template parameters which very likely will be derived from the Key Vault at some point anyway. To solve this, you can modify the JSON of an ADF linked service directly and inject KeyVault references into almost every property!
Lets have a look at the JSON of the Databricks linked service from above:

{
    "name": "Databricks",
    "properties": {
        "annotations": [],
        "type": "AzureDatabricks",
        "typeProperties": {
            "domain": "https://westeurope.azuredatabricks.net",
            "accessToken": {
                "type": "AzureKeyVaultSecret",
                "store": {
                    "referenceName": "KV_001",
                    "type": "LinkedServiceReference"
                },
                "secretName": "Databricks-AccessToken"
            },
            "existingClusterId": "0717-094253-sir805"
        },
        "description": "My Databricks Linked Service"
    },
    "type": "Microsoft.DataFactory/factories/linkedservices"
}

As you can see in lines 8-15, the property “accessToken” references the secret “Databricks-Accesstoken” from the Key Vault linked service “KV_001” and the actual value is populated at runtime.

After reading all this, you can probably guess what we are going to do next –
We also replace the other properties by Key Vault references:

{
    "name": "Databricks",
    "properties": {
        "type": "AzureDatabricks",
        "annotations": [],
        "typeProperties": {
            "domain": {
                "type": "AzureKeyVaultSecret",
                "store": {
                    "referenceName": "KV_001",
                    "type": "LinkedServiceReference"
                },
                "secretName": "Databricks-Workspace-URL"
            },
            "accessToken": {
                "type": "AzureKeyVaultSecret",
                "store": {
                    "referenceName": "KV_001",
                    "type": "LinkedServiceReference"
                },
                "secretName": "Databricks-AccessToken"
            },
            "existingClusterId": {
                "type": "AzureKeyVaultSecret",
                "store": {
                    "referenceName": "KV_001",
                    "type": "LinkedServiceReference"
                },
                "secretName": "Databricks-ClusterID"
            }
        }
    }
}

You now have a linked service that is configured solely by the Key Vault. If you think one step further, you can replace all values which are usually sourced by ARM parameters with Key Vault references instead and you will end up with an ARM template that only has two parameters – the name of the Data Factory and the URI of the Key Vault linked service! (you may even be able to derive the Key Vaults URI from the Data Factory name if the names are aligned!)

The only drawback I could find so far was that you cannot use the GUI anymore but need to work with the JSON from now on – or at least until you remove the Key Vault references again so that the GUI can display the JSON properly again. But this is just a minor thing as linked services usually do not change very often.

I also tried using the same approach to inject Key Vault references into Pipelines and Dataset but unfortunately this did not work 🙁
This is probably because Pipelines and Datasets are evaluated at a different stage and hence cannot dynamically reference the Key Vault.
Using Parameters and hidden Properties in Azure Data Factory v2

Azure Data Factory v2 is Microsoft Azure’s Platform as a Service (PaaS) solution to schedule and orchestrate data processing jobs in the cloud. As the name implies, this is already the second version of this kind of service and a lot has changed since its predecessor. One of these things is how datasets and pipelines are parameterized and how these parameters are passed between the different objects. The basic concepts behind this process are well explained by the MSDN documentation – for example Create a trigger that runs a pipeline on a schedule. In this example an trigger is created that runs a pipeline every 15 minute and passes the property “scheduledTime” of the trigger to the pipeline. This is the JSON expression that is used:

"parameters": {
  "scheduledRunTime": "@trigger().scheduledTime"
}

@trigger() basically references the object that is returned by the trigger and it seems that this object has a property called “scheduledTime”. So far so good, this is documented and fulfills the basic needs. Some of these properties are also documented here: System variables supported by Azure Data Factory but unfortunately not all of them.

So sometimes this trigger objects can be much more complex and also contain additional information that may not be documented. This makes it pretty hard for the developer to actually know which properties exist and how they could be used. A good example are Event-Based Triggers which were just recently introduced where the documentation only mentions the properties “fileName” and “folderPath” but it contains much more (details see further down). For simplicity I will stick to scheduled triggers at this point but the very same concept applies to all kinds of triggers and actually also to all other internal objects like @pipeline(), @dataset() or @activity() as well!

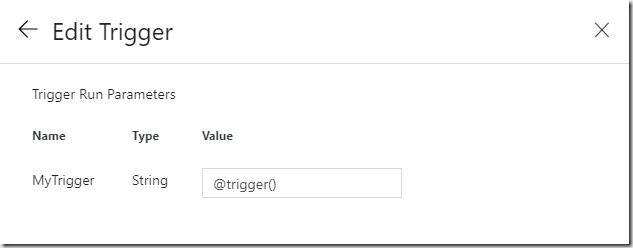
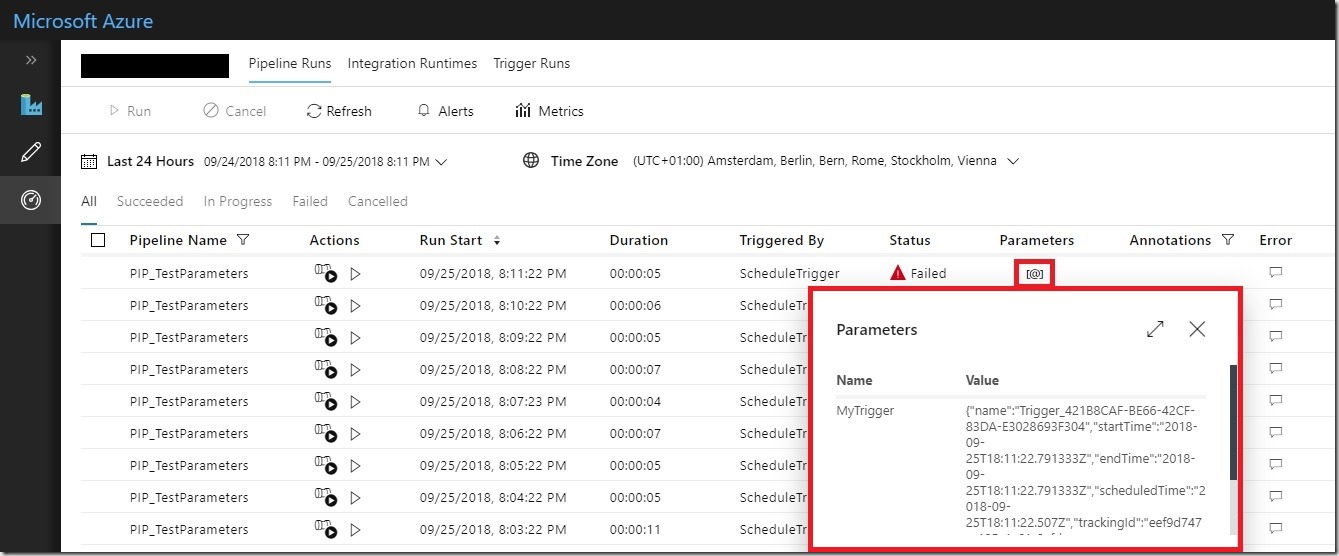
So how can you investigate those internal objects like @trigger() and see what they actually look like? Well, the answer is quite simple – just pass the object itself without any property to the pipeline. The target parameter of the pipeline can either be of type String or Object.
ADFv2_Set_Pipeline_Parameter_from_Trigger
This allows you to see the whole object on the Monitoring-page once the pipeline is triggered:
ADFv2_Monitor_Parameter_Value

For the Scheduled-trigger, the object looks like this:

@trigger() – Schedule-Trigger
{
  "name": "Trigger_12348CAF-BE66-42CF-83DA-E3028693F304",
  "startTime": "2018-09-25T18:00:22.4180978Z",
  "endTime": "2018-09-25T18:00:22.4180978Z",
  "scheduledTime": "2018-09-25T18:00:22.507Z",
  "trackingId": "1234a112-7bb9-4ba6-b032-6189d6dd8b73",
  "clientTrackingId": "12346637084630521889360938860CU33",
  "code": "OK",
  "status": "Succeeded"
}

And as you can guess, you can pass any of these properties to the pipeline using the syntax
“@trigger().<property_name>” or even the whole object! The syntax can of course also be combined with all the built-in expressions.

This should hopefully make it easier for you to build and debug more complex Azure Data Factory v2 pipelines!

Below you can find an example of the object that a Event-Based Trigger creates:

@trigger() – Event-Trigger
{
  "name": "Trigger_12348CAF-BE66-42CF-83DA-E3028693F304",
  "outputs": {
    "headers": {
      "Host": "prod-1234.westeurope.logic.azure.com",
      "x-ms-client-tracking-id": "1234c153-fc96-4b8e-9002-0f5096bcd744",
      "Content-Length": "52",
      "Content-Type": "application/json; charset=utf-8"
    },
    "body": {
      "folderPath": "data",
      "fileName": "myFile.csv"
    }
  },
  "startTime": "2018-09-25T18:22:54.8383112Z",
  "endTime": "2018-09-25T18:22:54.8383112Z",
  "trackingId": "07b3d1a1-8735-4ff0-9cc6-c83d95046101",
  "clientTrackingId": "56dcc153-fc96-4b8e-9002-0f5096bcd744",
  "status": "Succeeded"
}

Note that right now, it does not say whether the trigger fired because the file was created, updated or deleted! But I hope this will be fixed by the product team in the near future.

Deploying an Azure Data Factory project as ARM Template

In my last post I wrote about how to Debug Custom .Net Activities in Azure Data Factory locally. This fixes one of the biggest issues in Azure Data Factory at the moment for developers. The next bigger problem that you will run into is when it comes to deploying your Azure Data Factory project. At the moment, you can only do it manually from Visual Studio which, for bigger projects, can take quite some time. So I extended and advanced the code from my CustomActivityDebugger. Well, actually I rewrote some major parts of it and moved it into a new GitHub repository: Azure.DataFactory.LocalEnvironment

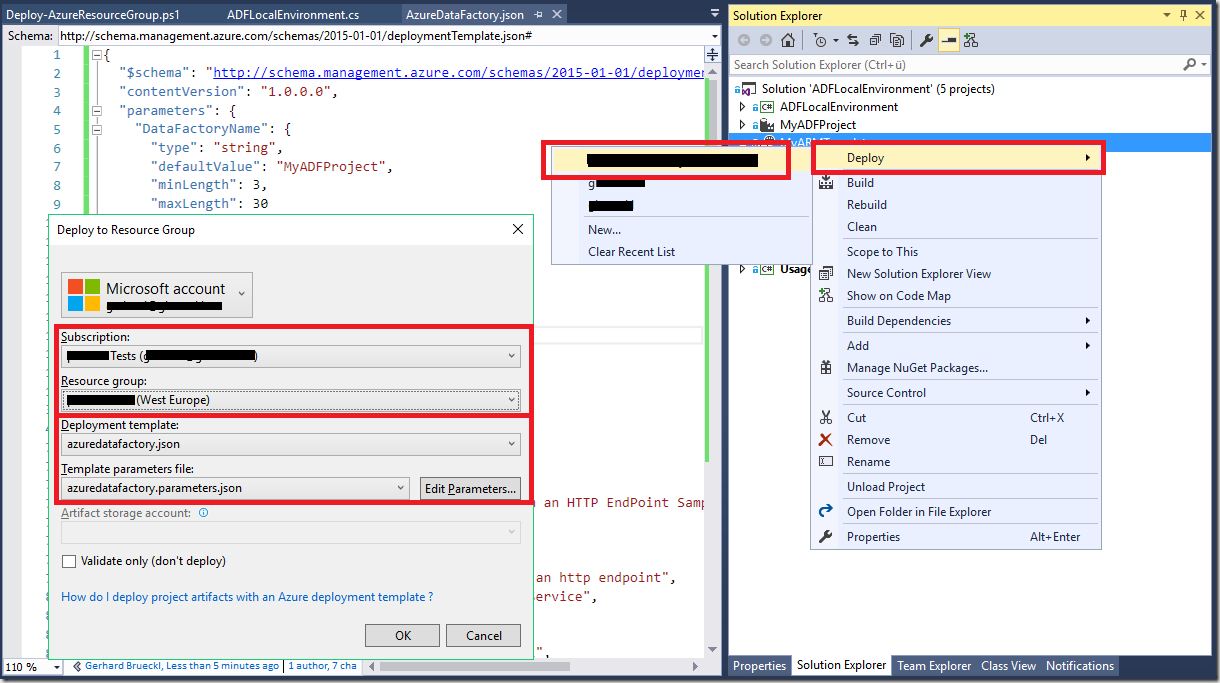
The new code base now includes the functionality to export an existing ADF project to an ARM template which can then be deployed very easily using Azure standard deployment mechanisms.

So basically, these are the changes and new Features that I made:

Export as ARM template:

  • Export all ADF objects and properties
  • Support for configurations
  • obey dependencies between ADF objects
  • parameterized Data Factory name
  • automatic upload of ADF dependencies (e.g. custom activities)
  • specify the region where ADF should be deployed (ADF is not available in all regions yet!)

ADF_LocalEnvironment_DeployARMTemplate

Custom Activity Debugger:

  • simplified usability – just select the pipeline, activity and set the slice-dates
  • Support for configurations
  • no need to add any namespaces
  • no need to add any references
  • write activity log to console output

ADF_LocalEnvironment_DebugActivity_Breakpoing

General:

  • Load from the ADF Project file (.dfproj) instead of a whole folder
  • implemented as Assembly
  • can be used in a Console Application for automation
  • will be published via NuGet in the future! (coming soon)


Everything else is described in the Git-Repository itself!

Hope you enjoy it!

Monitoring Azure Data Factory using PowerBI

Some time ago Microsoft released the first preview of a tool which allows you to monitor and control your Azure Data Factory (ADF). It is a web UI where you can select your Pipeline, Activity or Dataset and check its execution state over time. However, from my very personal point of view the UI could be much better, especially much clearer(!) as it is at the moment. But that’s not really a problem as the thing I like the most about ADF is that its quite open for developers (for example Custom C#/.Net Activities) and it also offers a quite comprehensive REST API to control an manage it.
For our monitoring purposes we are mainly interested in the LIST interface but we could do basically every operation using this API. In my example I only used the Dataset API, the Slices API and the Pipeline API.

First we start with the Dataset API to get a list of all data sets in our Data Factory. This is quite simple as we just need to build our URL of the REST web service like this:

  1. https://management.azure.com/subscriptions/{SubscriptionID}/resourcegroups/{ResourceGroupName}/providers/Microsoft.DataFactory/datafactories/{DataFactoryName}/datasets?api-version={api-version}

You can get all of this information for the Azure Portal by simply navigating to your Data Factory and checking the URL which will be similar to this one:

  1. https://portal.azure.com/#resource/subscriptions/1234567832324a04a0a66e44bf2f5d11/resourceGroups/myResourceGroup/providers/Microsoft.DataFactory/dataFactories/myDataFactory

So this would be my values for the API Call:
– {SubscriptionID} would be “12345678-3232-4a04-a0a6-6e44bf2f5d11”
– {ResourceGroupName} would be “myResourceGroup”
– {DataFactoryName} would be “myDataFactory”
– {api-version} would be a fixed value of “2015-10-01”

Once you have your URL you can use PowerBI to query the API using Get Data –> From Web
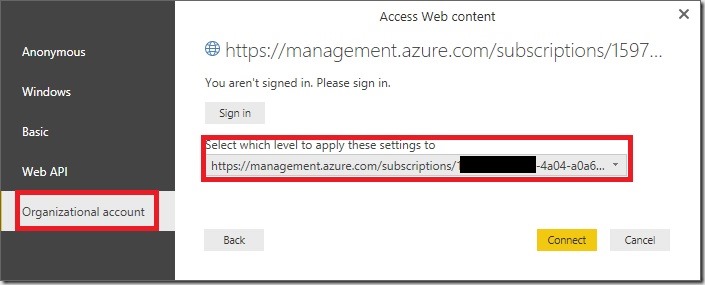
Next you need to authenticate using your Personal or Organizational Account – the same that you use to sign in to the Portal – and also the level for which you want to use the credentials. I’d recommend you to set it either to the subscription level or to the data-factory itself, depending on your security requirements. This ensures that you are not asked for credentials for each different API:
ADF_PowerBI_Authentication

This works in a very similar way also for the Slices API, the Pipeline API and all other APIs available! The other transformations I used are regular PowerQuery/M steps done via the UI so I am not going to describe them in more detail here. Also, setting up the relationships in our final PowerPivot model should be straight forward.

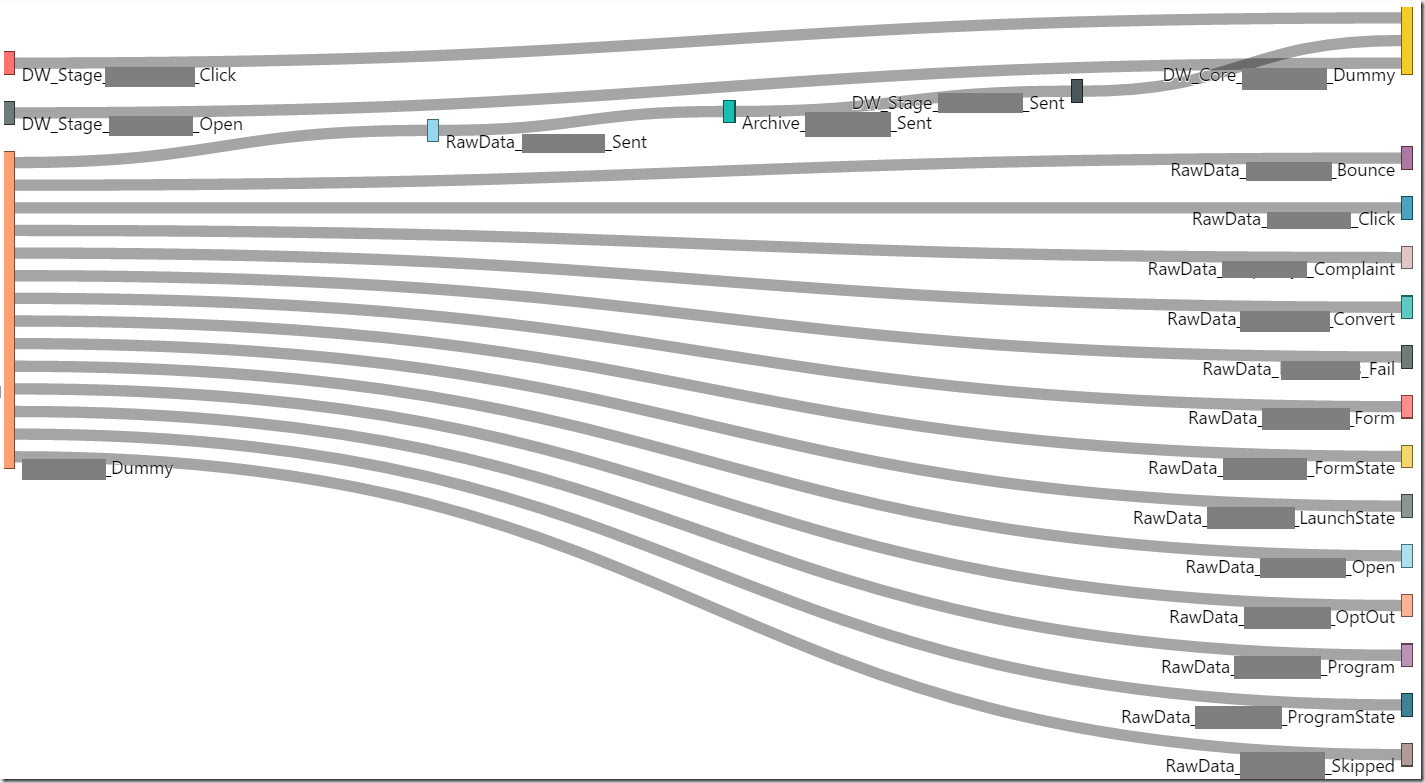
Now that we have all the required data in place, we can start with our report. I used some custom visuals for the calendar view, some slicers and a simple table to show the details. I also used a Sankey Chart to visualize the dependencies between the datasets.

ADF_PowerBI_Monitoring_Dashboard
ADF_PowerBI_Monitoring_Dependencies

Compared to the standard GUI for monitoring this provides a much better overview of slices and their current states and it also allows easy filtering. I am sure there are a lot of other PowerBI visualizations which would make a lot of sense here, these are just to give you an idea how it could look like, but of course you have all the freedom PowerBI offers you for reporting!

The only drawback at the moment is that you cannot reschedule/reset slices from PowerBI but for my monitoring-use-case this was not a problem at all. Also, I did not include the SliceRun API in my report as this would increase the size of the data model a lot, so detailed log information is not available in my sample report.

The whole PowerBI template is available for download on my GitHub site: https://github.com/gbrueckl/Azure.DataFactory.PowerBIMonitor

Debugging Custom .Net Activities in Azure Data Factory


UPDATE 2017-02-22:
I released a new toolset for Azure Data Factor which also integrates the Customer .Net Activity Debugger from this blob post. Please refer to the new GitHub project: https://github.com/gbrueckl/Azure.DataFactory.LocalEnvironment

(all links have been changed to refer to the new repository!)


Azure Data Factory (ADF) is one of the newer tools of the whole Microsoft Data Platform on Azure. It is Microsoft’s Data Integration tool, which allows you to easily load data from you on-premises servers to the cloud (and also the other way round). It comes with some handy templates to copy data fro various sources to any available destination. However, when the Extract-Transform-Load (ETL) or ELT steps get more complicated you will hit the (current) out-of-the-box limits of Azure Data Factory pretty soon. But this is OK as ADF is a very open platform and allows you to integrate so called “Custom Activities”. These can either be .Net/C# Activities or HDInsight Activities. In this post we will focus on .Net Activities and how to develop and debug them in an efficient way.

A .Net Activity is basically just a .dll which implements a specific Interface (IDotNetActivity)and is then executed by the Azure Data Factory. To be more precise here, the .dll (and all dependencies) are copied to an Azure Batch Node which then executes the code when the .Net Activity is scheduled by ADF. So far so good, but the tricky part is to actually develop the .Net code, test, and debug it. Well, not the code itself but the more or less complex integration with the ADF Interface which you are very likely not familiar with in the beginning. In such cases it usually helps to run the code locally, step into the different code paths and examine the C# objects and their values. The problem is that you do not have a local instance of ADF on your workstation which you could use the start the .Net Activity and debug it interactively in Visual Studio.
So I wrote my own tool which you can add to the Solution that already contains the code of your Custom .Net Activity. Then you can simply link the CustomActivityDebugger to the JSON definitions and configurations of your ADF project, reference your custom code, configure some other things like SliceStart/SliceEnd and you are ready to go.
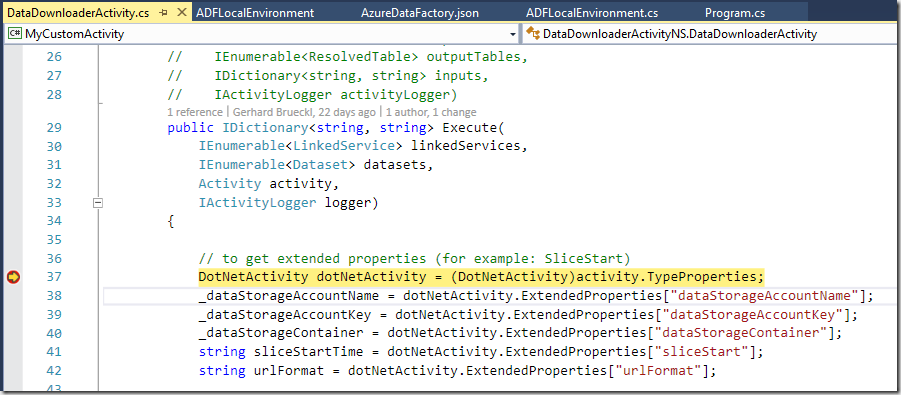
Once you start the CustomActivityDebugger it will read all ADF files and settings and basically create a local ADF environment which helps you to debug your custom .Net Activity using all settings and parameters as they would be passed in when the code is executed on the Azure Batch Node.

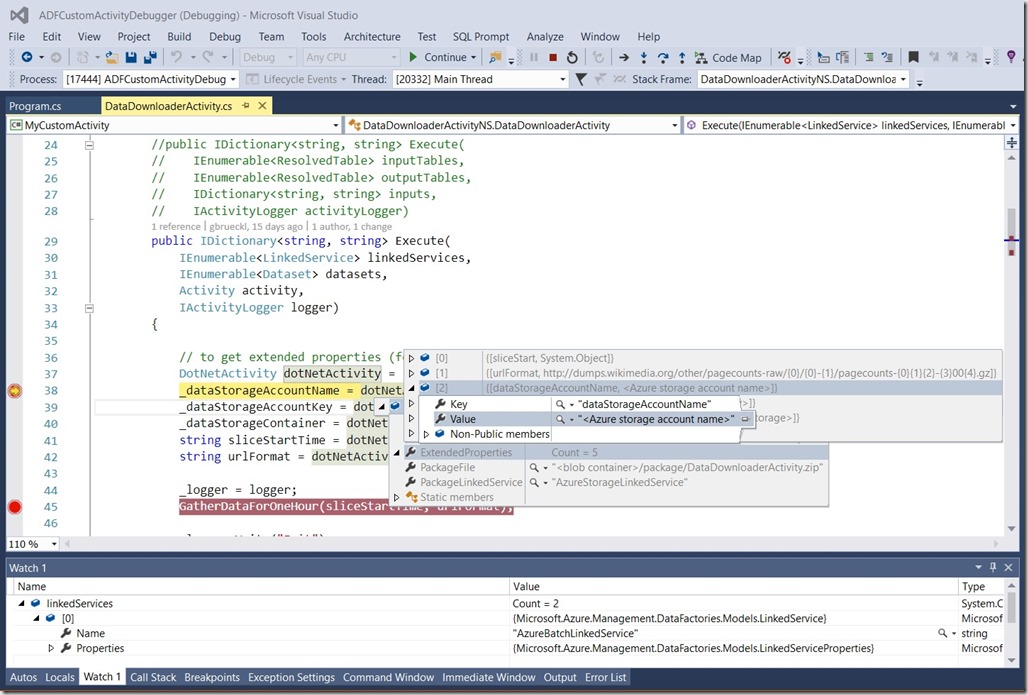
This little picture shows the CustomActivityDebugger in action – debugging custom .Net activities is now like debugging any other code:
Debugger_in_Action

All the sources including a simple ADF Project, a simple Custom Activity and setup instructions are available on my GitHub site:

https://github.com/gbrueckl/Azure.DataFactory.CustomActivityDebugger
https://github.com/gbrueckl/Azure.DataFactory.LocalEnvironment

Feel free to use it as it is and/or extend it to your needs.