In the past I have been working on a lot of different Power BI projects and it has always been (and still is) a pain when it comes to the deployment of changes across multiple tiers(e.g. Dev/Test/Prod). The main problem here being that a file generated in Power BI desktop (</mark>.pbix<mark style="background-color:#ffffff" class="has-inline-color has-black-color">) is basically a binary file and the metadata of the actual data model (BIM) cannot be easily extracted or derived. This causes a lot of problems upstream when you want to automate the deployment using CI/CD pipelines. Here are some common approaches to tackle these issues:
Use of Power BI deployment pipelines The most native solution, however quite inflexible when it comes to custom and conditional deployments to multiple stages
Creation a Power BI Template (.pbit) in addition to your .pbix<mark style="background-color:#ffffff" class="has-inline-color has-black-color"> file and check in both This works because the </mark></mark><mark style="background-color:#ffffff" class="has-inline-color">.pbit</mark><mark style="background-color:#ffffff" class="has-inline-color has-black-color"><mark style="background-color:#ffffff" class="has-inline-color has-black-color"> file basically contains the BIM file but its creation is also a manual step
Extraction of the BIM file while PBI desktop is still running (e.g. using Tabular Editor) With the support of external tools this is quite easy, but is still a manual step and requires a 3rd party tool
Development outside of PBI desktop (e.g. using Tabular Editor) Probably the best solution but unfortunately not really suited for business users and for the data model only but not for the Power Queries
As you can see, there are indeed some options, but none of them is really ideal, especially not for a regular business user (not talking about IT pros). So I made up my mind and came up with the following list of things that I would want to see for proper CI/CD with Power BI files:
Users should be able to work with their tool of choice (usually PBI desktop, optional with Tabular Editor or any other 3rd party tool)
Automatically extracting the metadata whenever the data model changes
Persisting the metadata (BIM) in git to allow easy tracking of changes
Using the persisted BIM file for further automation (CD)
Solution
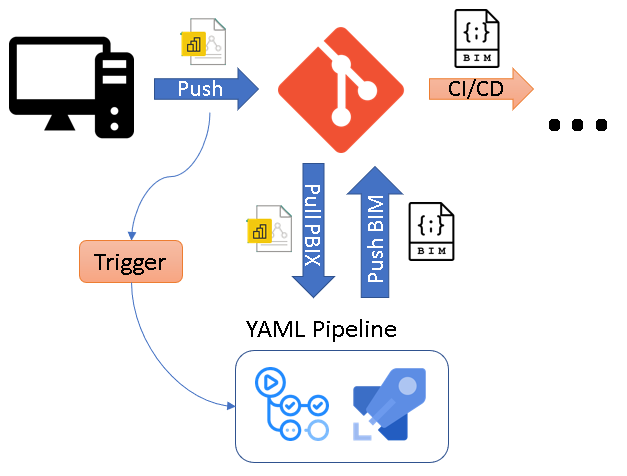
The core idea of the solution is to use CI/CD pipelines that automatically extracts the metadata of a .pbix file as soon as it is pushed to the Git repository. To do this, the .pbix file is automatically uploaded to a Power BI Premium workspace using the Power BI REST API and the free version of Tabular Editor 2 then extracts the BIM file via the XMLA endpoint and push it back to the repository.
I packaged this logic into ready-to-use YAML pipelines for Github Actions and Azure DevOps Pipelines being the two most common choices to use with Power BI. You can just copy the YAML files from the PowerBI.CICD repository to your own repo. Then simply provide the necessary information to authentication against the Power BI service and that’s it. As soon as everything is set up correctly. the pipeline will automatically create a .database.json for every PBIX file that you upload (assuming it contains a data model) and track it in your git repository!
All further details can be found directly in the repository which is also updated frequently!
I also contributed the connector described in this post to the official delta.io Connectors page and repo (link). You will find the most recent updates in my personal repo which are then merged to the official repo once it has been tested thoroughly!
Working with analytical data platforms and big data on a daily basis, I was quite happy when Microsoft finally announced a connector for Parquet files back in November 2020. The Parquet file format is developed by the Apache foundation as an open-source project and has become a fundamental part of most data lake systems nowadays.
“Apache Parquet is a columnar storage format available to any project in the Hadoop ecosystem, regardless of the choice of data processing framework, data model or programming language.”
However, Parquet is just a file format and does not really support you when it comes to data management. Common data manipulation operations (DML) like updates and deletes still need to be handled manually by the data pipeline. This was one of the reasons why Delta Lake (delta.io) was developed besides a lot of other features like ACID transactions, proper meta data handling and a lot more. If you are interested in the details, please follow the link above.
So what is a Delta Lake table and how is it related to Parquet? Basically a Delta Lake table is a folder in your Data Lake (or wherever you store your data) and consists of two parts:
Delta log files (in the sub-folder _delta_log)
Data files (Parquet files in the root folder or sub-folders if partitioning is used)
The Delta log persists all transactions that modified the data or meta data in the table. For example, if you execute an INSERT statement, a new transaction is created in the Delta log and a new file is added to the data files which is referenced by the Delta log. If a DELETE statement is executed, a particular set of data files is (logically) removed from the Delta log but the data file still resides in the folder for a certain time. So we cannot just simply read all Parquet files in the root folder but need to process the Delta log first so we know which Parquet files are valid for the latest state of the table.
These logs are usually stored as JSON files (actually JSONL files to be more precise). After 10 transactions, a so-called checkpoint-file is created which is in Parquet format and stores all transactions up to that point in time. The relevant logs for the final table are then the combination of the last checkpoint-file and the JSON files that were created afterwards. If you are interested in all the details on how the Delta Log works, here is the full Delta Log protocol specification.
From those logs we get the information which Parquet files in the main folder must be processed to obtain the final table. The content of those Parquet files can then simply be combined and loaded into PowerBI.
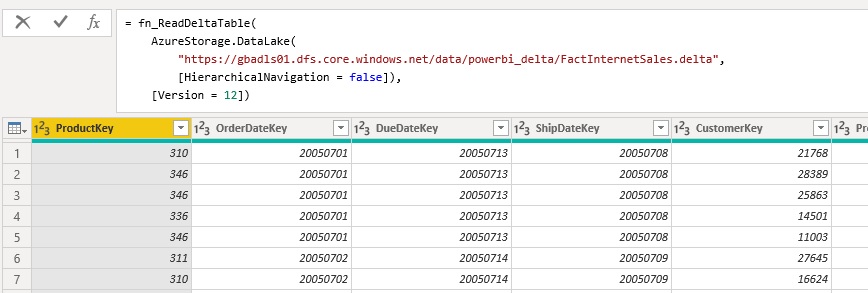
I encapsulated all this logic into a custom Power Query function which takes the folder listing of the Delta table folder as input and returns the content of the Delta table. The folder listing can either come from an Azure Data Lake Store, a local folder, or an Azure Blob Storage. The mandatory fields/columns are [Content], [Name] and [Folder Path]. There is also an optional parameter which allows you the specify further options for reading the Delta table like the Version if you want to use time-travel. However, this is still experimental and if you want to get the latest state of the table, you can simply omit it.
The most current M-code for the function can be found in my Github repository for PowerBI: fn_ReadDeltaTable.pq and will also be constantly updated there if I find any improvement. The repository also contains an PowerBI desktop file (.pbix) where you can see the single steps that make up for the final function.
Once you have added the function to your PowerBI / Power Query environment you can call it like this:
I would further recommend to nest your queries and separate the access to the storage (e.g. Azure Data Lake Store) and the reading of the table (execution of the function). If you are reading for an ADLS, it is mandatory to also specify [HierarchicalNavigation = false] ! If you are reading from a blob storage, the standard folder listing is slightly different and needs to be changed.
Right now the connector/function is still experimental and performance is not yet optimal. But I hope to get this fixed in the near future to have a native way to read and finally visualize Delta lake tables in PowerBI.
After some thorough testing the connector/function finally reached a state where it can be used without any major blocking issues, however there are still some known limitations:
Partitioned tables
currently columns used for partitioning will always have the value NULLFIXED!
values for partitioning columns are not stored as part of the parquet file but need to be derived from the folder pathFIXED!
Performance
is currently not great but this is mainly related to the Parquet connector as it seems
very much depends on your data – please test on your own!
Time Travel
currently only supports “VERSION AS OF”
need to add “TIMESTAMP AS OF”
Predicate Pushdown / Partition Elimination
currently not supported – it always reads the whole tableFIXED!
Any feedback is welcome!
Special thanks also goes to Imke Feldmann (@TheBIccountant, blog) and Chris Webb (@cwebb_bi, blog) who helped me writing and tuning the PQ function!
Calculating and visualizing semi- and non-additive measures like distinct count in Power BI is usually not a big deal. However, things can become challenging if your data volume grows and exceeds the limits of Power BI!
In one of my recent projects we wanted to visualize data from the customers analytical platform based on Azure Databricks in Power BI. The connection between those two tools works pretty flawless which I also described in my previous post but the challenge was the use-case and the calculations. We wanted to display the distinct customers across various aggregations levels over a billion rows fact table. We came up with different potential solutions all having their pros and cons:
load all data into Power BI (import mode) and do the aggregations there
use Power BI with direct query and let the back-end do the heavy lifting
load only necessary pre-aggregated data into Power BI (import mode)
Please keep in mind that we are dealing with a distinct count measure here. Semi- and Non-additive measure like this cannot easily be aggregated from lower levels to higher levels without having all the detail data available!
Option 1. has the obvious drawback that data model would be huge in size as we were dealing with billions of transactions. This would have exceeded our current size limits for Power BI data models.
Option 2. would usually work fine, but again, for the amount of data we were dealing with the back-end was just no able to provide sub-second latency that was required.
So we went for Option 3. and did the various aggregations on the different levels in Azure Databricks and loaded only the final results to Power BI. First we wanted to use Power BI Aggregations and Composite Models. Unfortunately, this did not work out for us as we were not in control which aggregation table (we had multiple for the different aggregation levels) was used by the engine which potentially resulted in wrong results when additional aggregation was done in Power BI. Also, when slicing for random aggregation levels, Power BI was querying the details in direct query mode causing very poor query performance.
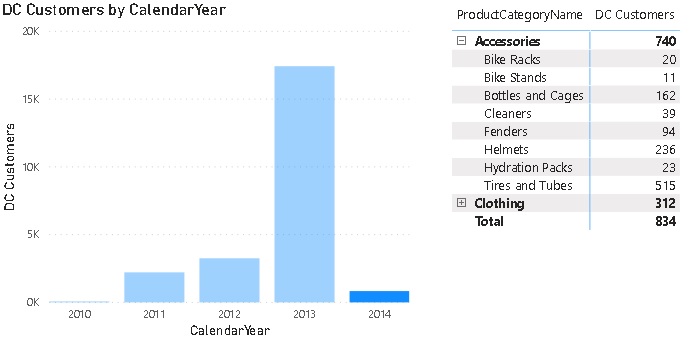
After some further thinking we came up with a new solution which was also based on pre-calculated aggregations but not realized using built-in aggregation tables but having a combined table for all aggregations and some very straight-forward DAX to select the row we wanted! In the end the whole solution consisted of one SQL view using COUNT(DISTINCT xxx) aggregation and GROUP BY GROUPING SETS (T-SQL, Databricks, … supported in all major SQL engines) and a very simple DAX measure!
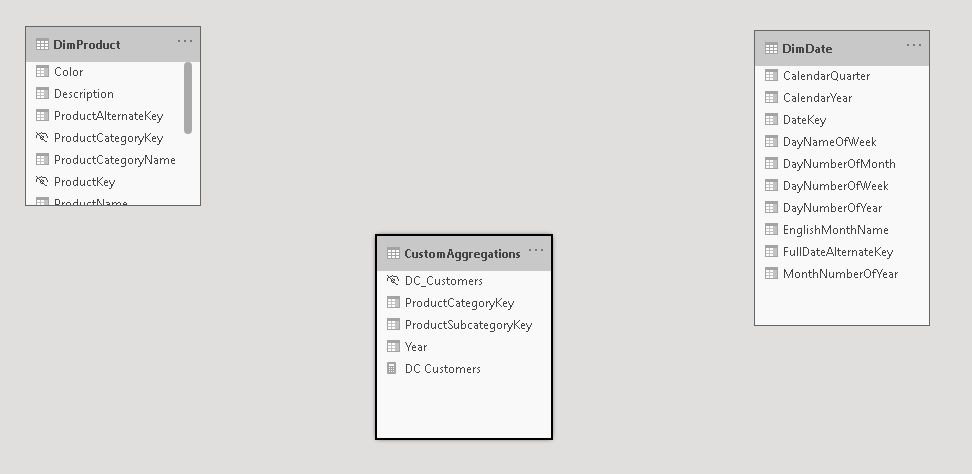
Here is a little example that illustrates the approach. Assume you want to calculate the distinct customers that bought certain products in a subcategory/category by year. The first step is to create a view that provides this information:
SELECT
	od.[CalendarYear] AS [Year],
	dp.[ProductSubcategoryKey] AS [ProductSubcategoryKey],
	dp.[ProductCategoryKey] AS [ProductCategoryKey],
	COUNT(DISTINCT CustomerKey) AS [DC_Customers]
FROM [dbo].[FactInternetSales] fis
INNER JOIN [dbo].[vDimProductHierarchy] dp
	ON fis.[ProductKey] = dp.[ProductKey]
INNER JOIN dbo.[DimDate] od
	ON fis.[OrderDatekey] = od.[DateKey]
GROUP BY
GROUPING SETS (
	(),
	(od.[CalendarYear]),
	(od.[CalendarYear], dp.[ProductSubcategoryKey], dp.[ProductCategoryKey]),
	(od.[CalendarYear], dp.[ProductCategoryKey]),
	(dp.[ProductSubcategoryKey], dp.[ProductCategoryKey]),
	(dp.[ProductCategoryKey])
)
Please note that when we have a natural relationship between hierarchy levels (= only 1:n relationships) we need to specify the current level and also all upper levels to allow a proper drill-down later on! E.g. ProductCategory (1 -> n) ProductSubcategory
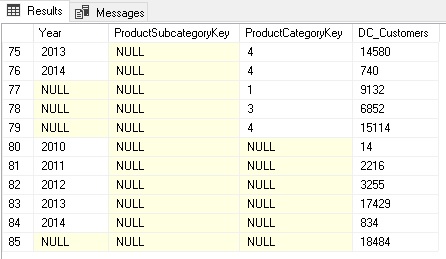
This calculates all the different aggregation levels we need. Columns with NULL mean they were not filtered/grouped by when calculating the aggregation. Rows 80-84 contain the aggregations grouped by Year only whereas rows 77-79 contain only aggregates by ProductCategoryKey. The rows 75-76 were aggregated by Year AND ProductCategoryKey. Depending on your final report layout, you may not need all of them and you should consider removing those that are not needed!
This table is then loaded into Power BI. You can either use a custom SQL query like above in Power BI directly or create a view in the back-end system which would be my preferred solution. Alternatively you can also create all these grouping sets using Power Query/M. The incredible Imke Feldmann (t, b) came up with a solution that allows you to specify the grouping sets in a similar way as in SQL and do all this magic within Power BI directly! I hope she will blog about it pretty soon! (The sample workbook at the end of this post also contains a little preview of this M-magic.)
Now that we have all the data we need in Power BI, we need to display the right values for the selections in the report which of course can be dynamic. That’s a bit tricky but once you understand the concept, it is pretty straight forward. First of all, the table containing the aggregations must not be related to any other table as we build them on the fly within our DAX measure. The table itself can also be hidden.
And this is the final DAX for our measure:
DC Customers =
VAR _sel_SubcategoryKey = SELECTEDVALUE(DimProduct[ProductSubcategoryKey])
VAR _sel_CategoryKey = SELECTEDVALUE(DimProduct[ProductCategoryKey])
VAR _sel_Year = SELECTEDVALUE(DimDate[CalendarYear])
VAR _tbl_Agg = CALCULATETABLE(
    'CustomAggregations',
    TREATAS({_sel_SubcategoryKey}, CustomAggregations[ProductSubcategoryKey]),
    TREATAS({_sel_CategoryKey}, CustomAggregations[ProductCategoryKey]),
    TREATAS({_sel_Year}, CustomAggregations[Year])
)
VAR _AggCount = COUNTROWS(_tbl_Agg)
RETURN
    IF(_AggCount = 1, MAXX(_tbl_Agg, [DC_Customers]), _AggCount * -1)
The first part is to get all the selected values of the lookup/dimension tables the user selects on the report. These are all the _sel_XXX variables. SELECTEDVALUE() returns the selected value if only one item is in the current filter context and BLANK()/NULL otherwise. We then use TREATAS() to apply those filters (either a single item or NULL) to our aggregations table. This should usually only return a table with a single row so we can use MAXX() to get our actual value from that one row. I also added a check in case multiple rows are returned which can potentially happen if you use multi-selects in your filters and instead of showing wrong values I’d rather indicate that there is something wrong with the calculation.
The measure can then be sliced and diced by our pre-defined aggregation levels as if it would be a regular measure but instead of having to process those expensive calculations on the fly we use the pre-calculated aggregates!
One thing to be aware of is that it will produce wrong results if multiple items for any of the aggregation levels are selected so it is highly recommended to set all slicers/filters to single select only or ensure that the filtered aggregation levels are also used in the chart. In this case only the grand total will show wrong values or NULL then. This could also be fixed in the DAX measure by checking how many rows are actually selected for each level and throw an error in case it is used in a filter and the count of values is > 1.
I did some further thinking and this approach could probably also be used to mimic custom roll-ups and unary operators we know from Analysis Services Multidimensional cubes. If I find some proper examples and this turns out to be feasibly I will write another blog post about it!
I work a lot with Azure Databricks and a topic that always comes up is reporting on top of the data that is processed with Databricks. Even though notebooks offer some great ways to visualize data for analysts and power users, it is usually not the kind of report the top-management would expect. For those scenarios, you still need to use a proper reporting tool, which usually is Power BI when you are already using Azure and other Microsoft tools.
So, I am very happy that there is finally an official connector in PowerBI to access data from Azure Databricks! Previously you had to use the generic Spark connector (docs) which was rather difficult to configure and did only support authentication using a Databricks Personal Access Token.
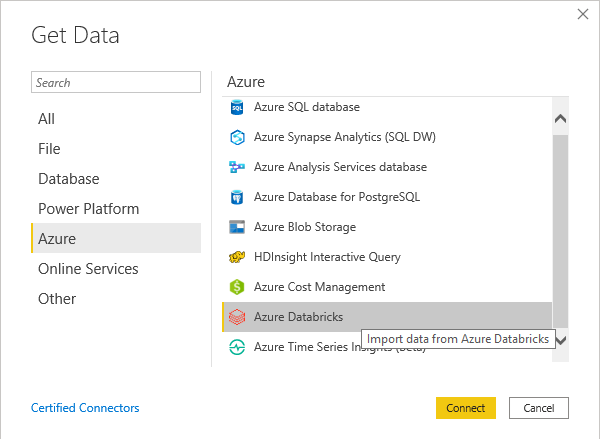
With the new connector you can simply click on “Get Data” and then either search for “Azure Databricks” or go the “Azure” and scroll down until you see the new connector:
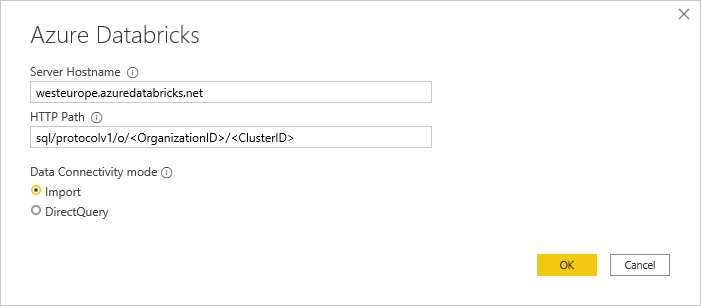
The next dialog that pops up will ask you for the hostname and HTTP path – this is very similar to the Spark connector. You find all the necessary information via the Databricks Web UI. As this connection is always bound to an existing cluster you need to go the clusters details page and check the Advanced Tab “JDBC/ODBC” as described here: (NOTE: you can simply copy the Server Hostname and the HTTP Path from the cluster page)
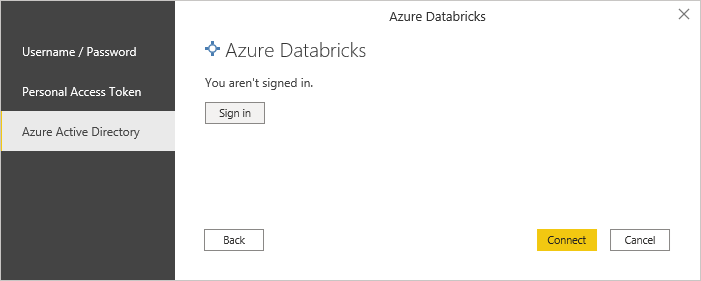
The last part is then the authentication. As mentioned earlier the new connector now also supports Azure Active Directory authentication which allows you to use the same user that you use to connect to the Databricks Web UI! Personal Access Tokens are also still supported and there is also Basic authentication using username/password.
Once you are connected, you can choose the tables that you want to import/connect and start building your report!
Here is also a quick overview which features are supported by the Spark and the Azure Databricks connector as there are some minor but important differences:
Feature Comparison
Spark Connector
Databricks Connector
Power BI Desktop
YES
YES
Power BI Service
YES
YES *
Direct Query (Desktop)
YES
YES
Direct Query (Service)
YES
YES *
Import Mode
YES
YES
Manual Refresh (Service)
YES
YES *
Scheduled Refresh (Service)
YES
YES *
Azure Active Directory (AAD) Authentication
NO
YES
Personal Access Token Authentication
YES
YES
Username/Password Authentication
YES
YES
General Available
YES
YES
Performacne Improvements with Spark 3.x
NO *
YES *
Supports On-Premises data gateway
YES
NO
Features supported by Spark and Databricks Connector for PowerBI
*) Updated 2020-10-06: the new Databricks Connector for PowerBI now supports all features also in the PowerBI service!
Update 2020-10-06: So from the current point of view the new Databricks Connector is a superset of old Spark Connector with additional options for authentication and better performance with the latest Spark versions. So it is highly recommended to use the new Databricks Connector unless you have very specific reasons to use the Spark connector! Actually the only reason why I would still use the Spark connector is the support for the On-Premises data gateway in case your Spark or Databricks cluster is hosted in a private VNet.
So currently the generic Spark connector still looks superior simply for the support in the Power BI Service. However, I am quite sure that it will be fully supported also by the Power BI Service in the near future. I will update this post accordingly! On the other hand, Azure Active Directory authentication is a huge plus for the native Azure Databricks connector as you do not have to mess around with Databricks Personal Access Tokens (PAT) anymore!
Another thing that I have not yet tested but would be very interesting is whether Pass-Through security works with this new connector. So you log in with your AAD credentials in Power BI, they get passed on to Databricks and from there to the Data Lake Store. For Databricks Table Access Control I assume this will just work as it does for PAT as it is not related to AAD authentication.
I frequently work on projects where we have multiple tiers on which our solution is deployed to using continuous integration / continuous deployment (CI / CD) pipelines in Azure DevOps. Once everything is deployed, you also need to monitor these different environments and check the status of the data or ETL pipelines. My tool of choice is usually Power BI desktop as it allows me to connect to e.g. SQL databases very easily. However, I always ended up creating a multiple Power BI files – one for each environment.
Having multiple files results in a lot of overhead when it comes to maintenance and also managing these files. Fortunately, I came across this little trick when I was investigating in composite models and aggregations that I am going to explain in this blog post.
To be honest, I barely used Power BI Direct Query in past and so maybe this feature has been there for quite some time without me realizing it but It may also be that it was introduced just recently with composite models.
So the “feature” is, that you can also use Query Parameters to parameterize your Direct Query queries. This is pretty awesome if you think of it for a second:
easy switching between databases
use one file for all environments
only maintain a single file
no need to import/load any data
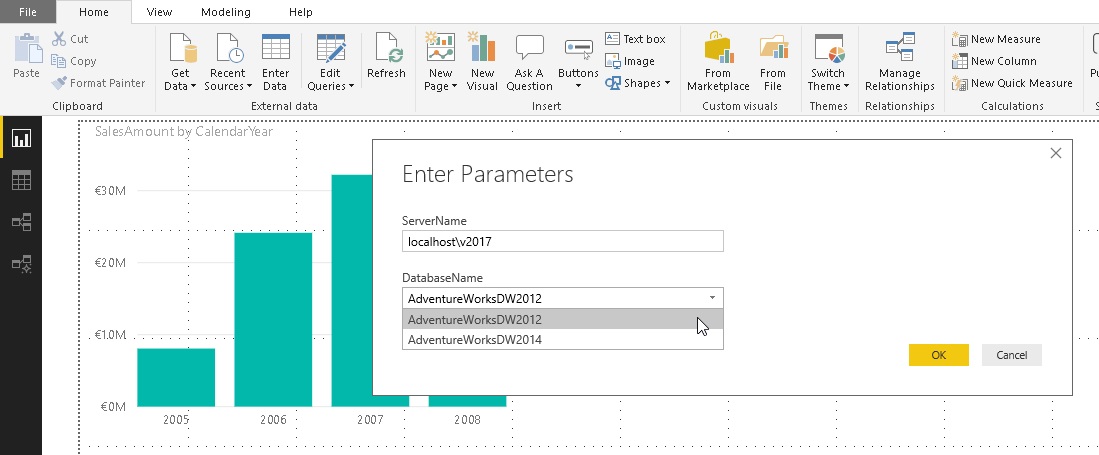
Power BI DirectQuery with Parameters
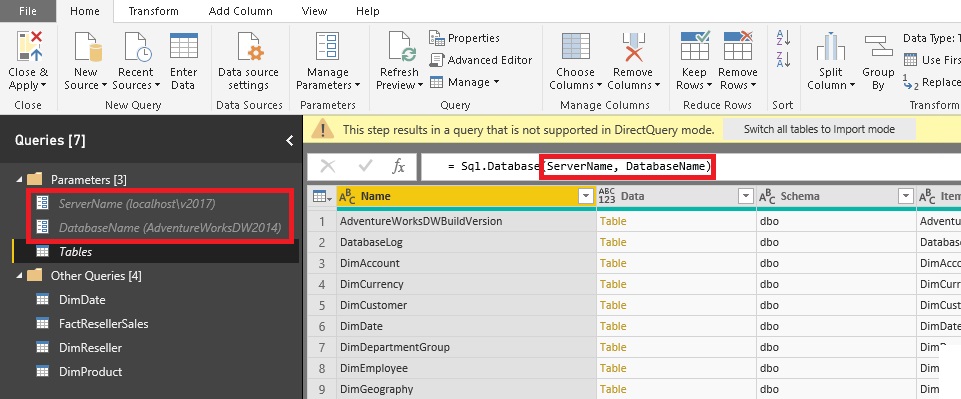
The configuration within Power Query is also quite easy – simply replacing the hard coded values with the ones from the parameters:
Power Query configuration using Parameters instead of hard-coded values
And that’s it already! you can now easily switch between different databases by just using Power BI parameters and the Direct Query connection will change automatically to the new server/database.
Of course, all the target servers/databases have to have the same schema otherwise, you will get an error.
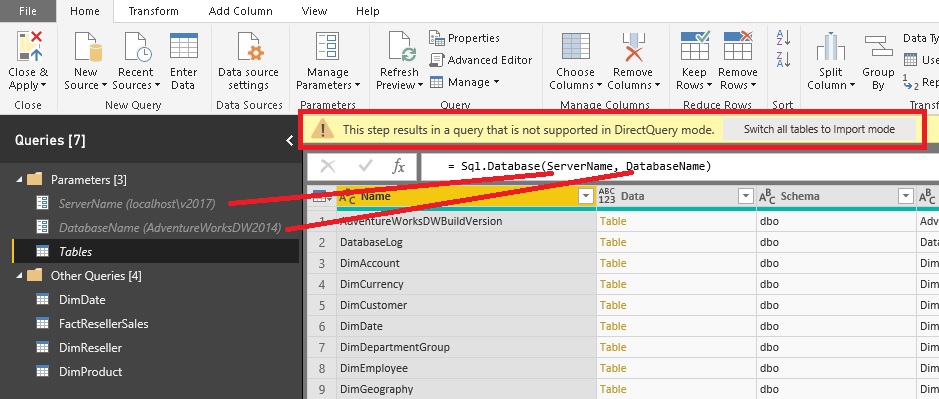
Caveats: Even though this looks quite trivial, there are some caveats which makes me believe this is not fully supported yet. You may noticed above already that in Power Query, when going to the step that actually queries the database, it complains about that this step would cause the whole table to be converted to Import Mode. However, you can just ignore it and go on with the next step to remain in Direct Query Mode.
Ignore warning and DO NOT convert to Import Mode
It seems like Power BI keeps track from where a table was originally imported. So if you want to add a new table, make sure to copy an existing Direct Query table and change it accordingly instead of going to “New Source > …” !
Also, you need to make sure that you have entered the credentials for the different source databases at least once – otherwise Power BI will ask you when you query the database the first time. This is also the reason why this does not work so well in the Power BI service as changing the parameters there is not as simple as it is in Power BI desktop.
As I said, I do not know if this is a new feature (or a feature at all), but it is definitely helpful for certain scenarios.
I just had the request to expose the UniqueNames of an Analysis Services Multidimensional cube in PowerBI. You may ask why I would want to do this and the answer is actually pretty simple: In SSAS MD the caption of elements/members even within the same attribute is not necessarily unique. This is because of the Key/Name concept where the elements/members are grouped by the Key but for the end-user a proper Name is displayed. So if you happen to have duplicate Names in your cube, import the values into PowerBI you will end up with less rows (and wrong values!) compared to the original SSAS MD cube because PowerBI (and also Analysis Services Tabular) does not have a Key/Name concept and therefore the grouping and what is display is always the same.
Having worked quite a lot with SSAS MD in the past I knew that every attribute member contains various internal properties, one of them being the UniqueName, which, as the name implies, is the unique identifier for each member regardless of the caption displayed for that member. And that’s exactly what I needed in this scenario. So the question is how to get this information in PowerBI as this is nothing that should usually be exposed to an end-user.
Anyway, I started to dig into this topic and made some this. Basically this is what I want to achieve:
For my sample I used to Adventure Works MD cube, opened it in PowerBI using Import-Mode and just selected the [Product].[Subcategory] hierarchy:
The UI is quite limited here and you can only select hierarchies and measures. However, getting the UniqueName of a given hierarchy can be achieved quite easily in a subsequent step by adding a new custom column:
And that’s already all you need to do. The column [Product.Subcategory] contains various information, one of them being the UniqueName of the product subcategory which can be accessed by the Cube.AttributeMemberId function.
My next step was to try to get some other properties in a similar way using the Cube.AttributeMemberProperty function. According to the documentation it is quite similar to Cube.AttributeMemberId but takes an additional parameter where you can define which property you want to retrieve. As the [Product].[Subcategory] hierarchy has a property called “Category” I tried this:
This caused a huge error in PowerBI desktop and so I tried different styles to define the property:
None of these worked though, neither for the regular properties nor for the internal ones. The main problem seems to be that the MDX query executed does not query any other properties except for the UniqueName not even if you specify them manually in your PowerQuery script. This means that so far there is no way to access member properties from within PowerBI. There is already a user voice where you can vote for this: https://ideas.powerbi.com/forums/265200-power-bi-ideas/suggestions/12443955-member-properties-ssas
Download:PowerBI_UniqueNames.pbix This PowerBI Desktop model contains all samples from above including the my failed tries for the properties!
As some of you probably remember, when PowerPivot was still only available in Excel and Power Query did not yet exist, it was possible to load images from a database (binary column) directly into the data model and display them in PowerView. Unfortunately, this feature did not work anymore in PowerBI Desktop and the only way to display images in a visual was to provide the URL of the image which is public accessible. The visual would then grab the image on-the-fly from the URL and render it. This of course has various drawbacks:
The image needs to be available via a public URL (e.g. upload it first to an Azure Blob Store)
The image cannot be displayed when you are offline
The link may break in the future or point to a different image as initially when the model was built
Until today I was sure that we have to live with this limitation but then I came across this blog post from Jason Thomas aka SqlJason. He shows a workaround to store images directly in the PowerBI data model and display them in the report as if they were regular images loaded from an URL. This is pretty awesome and I have to dedicate at least 99.9% of this blog post to Jason and his solution!
However, with this blog post I would like to take Jasons’ approach a step further. He creates the Base64 string externally and hardcodes it in the model using DAX. This has some advantages (static image, no external dependency anymore, …) but also a lot of disadvantages (externally create the Base64 string, manually copy&paste the Base64 string for each image, hard to maintain, cannot dynamically add images …). For scenarios where you have a local folder with images, a set of [private] URLs pointing to images or images stored in a SQL table (as binary) which you want to load into your PowerBI data model, this whole process should be automated and ideally done within PowerBI.
Fortunately, this turns out to be quite simple! Power Query provides a native function to convert any binary to a Base64 encoded string: Binary.ToText() . The important part to point out here is to use the second parameter which allows you to set the encoding of the resulting text. It supports two values: BinaryEncoding.Base64 (default) and BinaryEncoding.Hex. Once we have the Base64 string, we simply need to prefix it with the following meta data: “data:image/jpeg;base64, “
To make it easy, I wrote to two custom PowerQuery functions which convert and URL or a binary image to the appropriate string which can be used by PowerBI:
let
    UrlToImage = (ImageUrl as text) as text =>
let
    BinaryContent = Web.Contents(ImageUrl),
    Base64 = "data:image/jpeg;base64, " & Binary.ToText(BinaryContent, BinaryEncoding.Base64)
in
    Base64
in
    UrlToImage
let
    BinaryToPbiImage = (BinaryContent as binary) as text=>
let
    Base64 = "data:image/jpeg;base64, " & Binary.ToText(BinaryContent, BinaryEncoding.Base64)
in
    Base64
in
    BinaryToPbiImage
If your images reside in a local folder, you can simply load them using the “Folder” data source. This will give you a list of all images and and their binary content as separate column. Next add a new Custom Column where you call the above function to convert the binary to a prefixed Base64 string which can then be displayed in PowerBI (or Analysis Services) as a regular image. Just make sure to also set the Data Category of the column to “Image URL”:
And that’s it, now your visual will display the image stored in the data model without having to access any external resources!
Caution: As Jason also mentions at the end of his blog post, there is an internal limitation about the size of a text column. So this may cause issues when you try to load high-resolution images! In this case, simply lower the size/quality of the images before you load them. UPDATE May 2019: Chris Webb provides much more information and a solution(!) to this issue in his blog post: https://blog.crossjoin.co.uk/2019/05/19/storing-large-images-in-power-bi-datasets
Download:StoreImageInPbiModel.pbix This PowerBI Desktop model contains all samples from above including the PowerQuery functions!
Since April 2017 it is possible to build reports on top of datasets that are hosted in the PowerBI service. This was announced and described here and here in more detail. This might not seem like a big deal at first sight, but it can have a huge impact on how you work with PowerBI. By separating the data model from the report, you can have two or more independent people working with the same dataset. Also, the people who build the reports in the end most not necessarily have the knowledge to build a data model – the just need to use it. So, there are some clear advantages when you split up your workbook:
separation of duty (data modeler vs. report builder)´
any number of reports on top of the same model
easy control over reports as the files are quite small (they only contain the definition of the report)
This is all pretty cool and, from my point of view, the way to go once you want to use the reports in production and/or have several people working on/with the same reports.
But lets go a step further. After some time, as your data model grows, you realize that the reports get slow and also the processing takes a considerable amount of time to finish. The official upgrade path will then guide you to Azure Analysis Services and you will migrate your data model to deal with the larger data volumes and make use of the flexibility in processing you gained by your upgrade. This migration process is very well described here.
So far so good, but what happens to your reports? Last week I was in exactly the position described above and we had to migrate the existing reports (which were base on a dataset hosted in PowerBI) to Azure Analysis Services. As of now, there is now simple way to simply change the connection string from PowerBI to Azure Analysis Services neither in PBI Desktop nor in the Service. But we could think of some options how it might work:
rebuild all reports
use the REST API to update the connection string of the existing reports
modify the .pbix file manually (NOT OFFICIALLY SUPPORTED)
As you can imagine, rebuilding all reports was not really an option.
The next option, the PowerBI REST API looked pretty promising at first sight. It allows you to retrieve and set the dataset that is used by your report. So the idea is to simply create a new dataset which points to Azure Analysis Services in Live Query mode, take the existing report and use the Rebind API call to bind it to the new AAS dataset. Even though this is supposed to work, I could not make it work in my environment. I tried all things that I could think of but nothing work and I also gave up on this.
So I was stuck there but knew that the information of the data source has to be somewhere in the .pbix file. In the past I already did something similar with Excel/PowerPivot files (“Restoring a SSAS Tabular model to PowerPivot”) so I thought I would also give it a try for .pbix files. And it turns out that they are quite similar. For those of you who are new to this, most (if not all) of the files that are associated with a Microsoft tool and end with “x” (e.g. .xlsx/docx/…) are just ZIP-files in the end. To unzip them, simply rename them to .zip and use your favorite zip-tool to open them. You will see a file-structure similar to the one below:
(If your file contains a data model, you see a file called “DataModelSchema” instead of “Connections”. The next steps will not work in this case!). However, in our case, as the report is linked to a dataset hosted in the PowerBI service, our file does not contain any data itself but only the connection information to our data source. As you can guess, this information is stored in the “Connections” file.
To see what a connection to an Azure Analysis Services dataset looks like, I simply created a new PowerBI desktop model and established a Live Connection. Saved it and opened it again as zip file. The Connection file itself is just a JSON but the details are not really relevant here. I simply replaced the Connections file from my original report with the one from my new workbook linked to AAS. Renamed it back to pbix, opened it and voilà, my report was connected to AAS!
This saved us a lot of time and we could move all of our reports within a couple of hours!
Please keep in mind, that this is not officially supported and might break your model. So make sure to always create a backup before you modify the contents of a pbix file manually!
I do not take any responsibility for any broken models or anything else that might happen!