Data Virtualization in Microsoft Power BI – Part 2

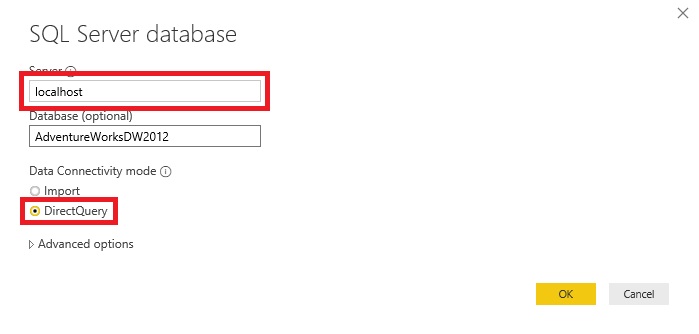
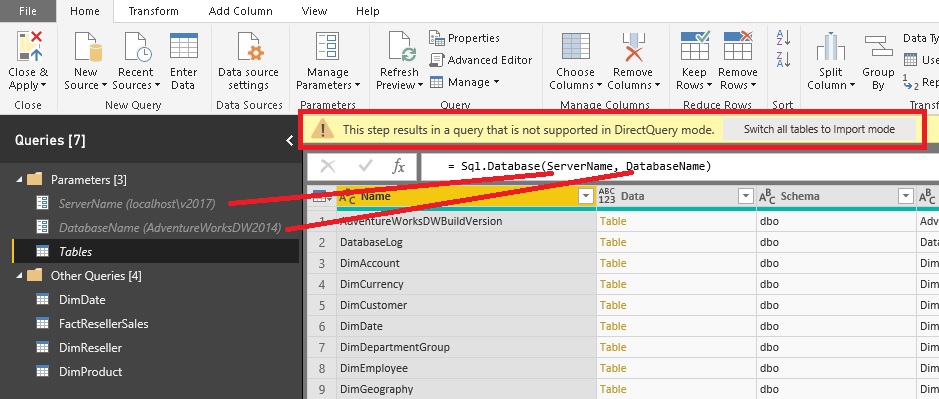
In my previous post I showed how you can use Microsoft Power BI to create a Data Virtualization layer on top of multiple relational data sources querying them all at the same time through one common model. As I already mentioned in the post and what was also pointed out by Adam Saxton (b, t) in the comments is the fact, that this approach can cause serious performance problems at the data source and also on the Power BI side. So in this post we will have a closer look on what actually happens in the background and which queries are executed when you join different data sources on-the-fly.

We will use the same model as in the previous post (you can download it from there or at the end of this post) and run some basic queries against it so we can get a better understanding of the internals.
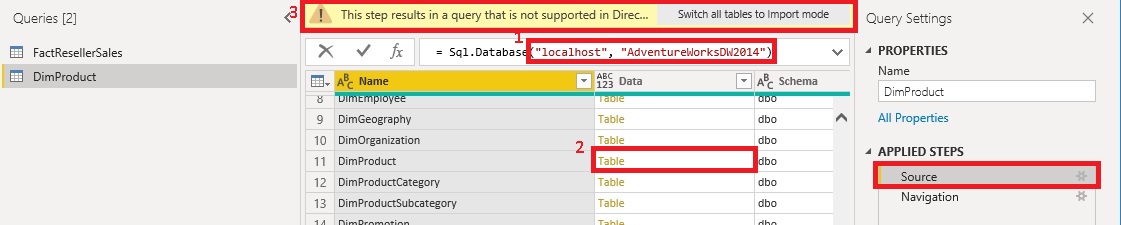
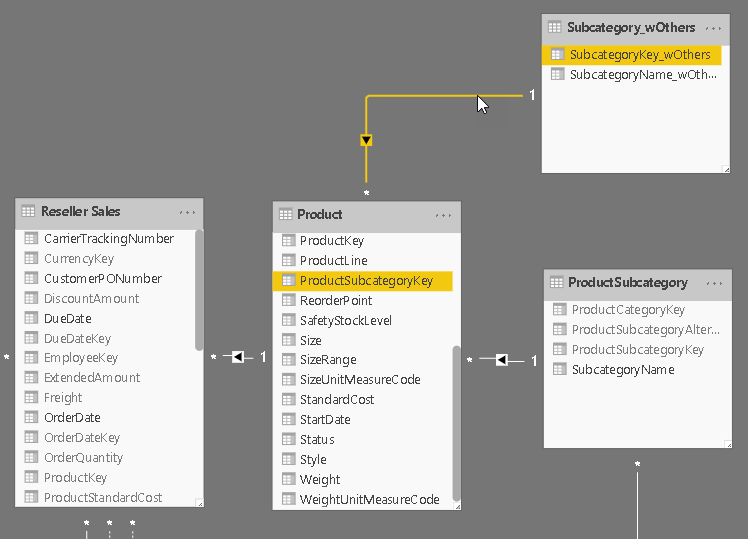
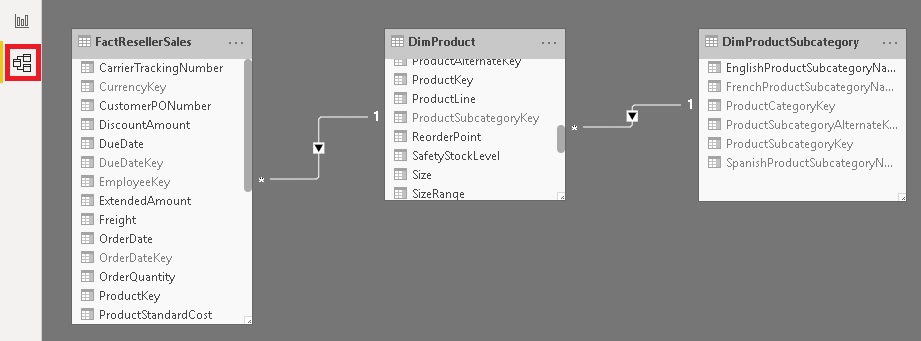
Here is our relationship diagram again as a reference. Please remember that each table comes from a different SQL server:

Relationships

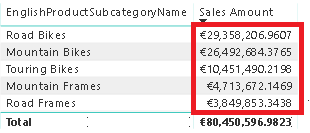
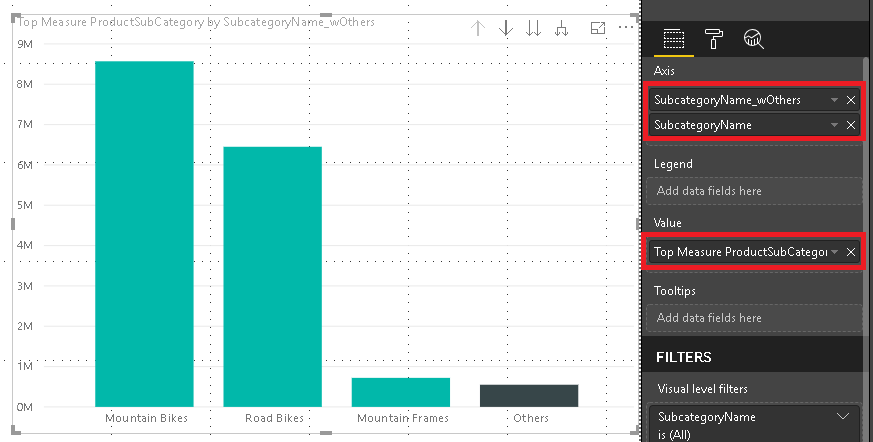
In our test we will simply count the number of products for each Product Subcategory:

NumberOfProducts_by_SubCategory

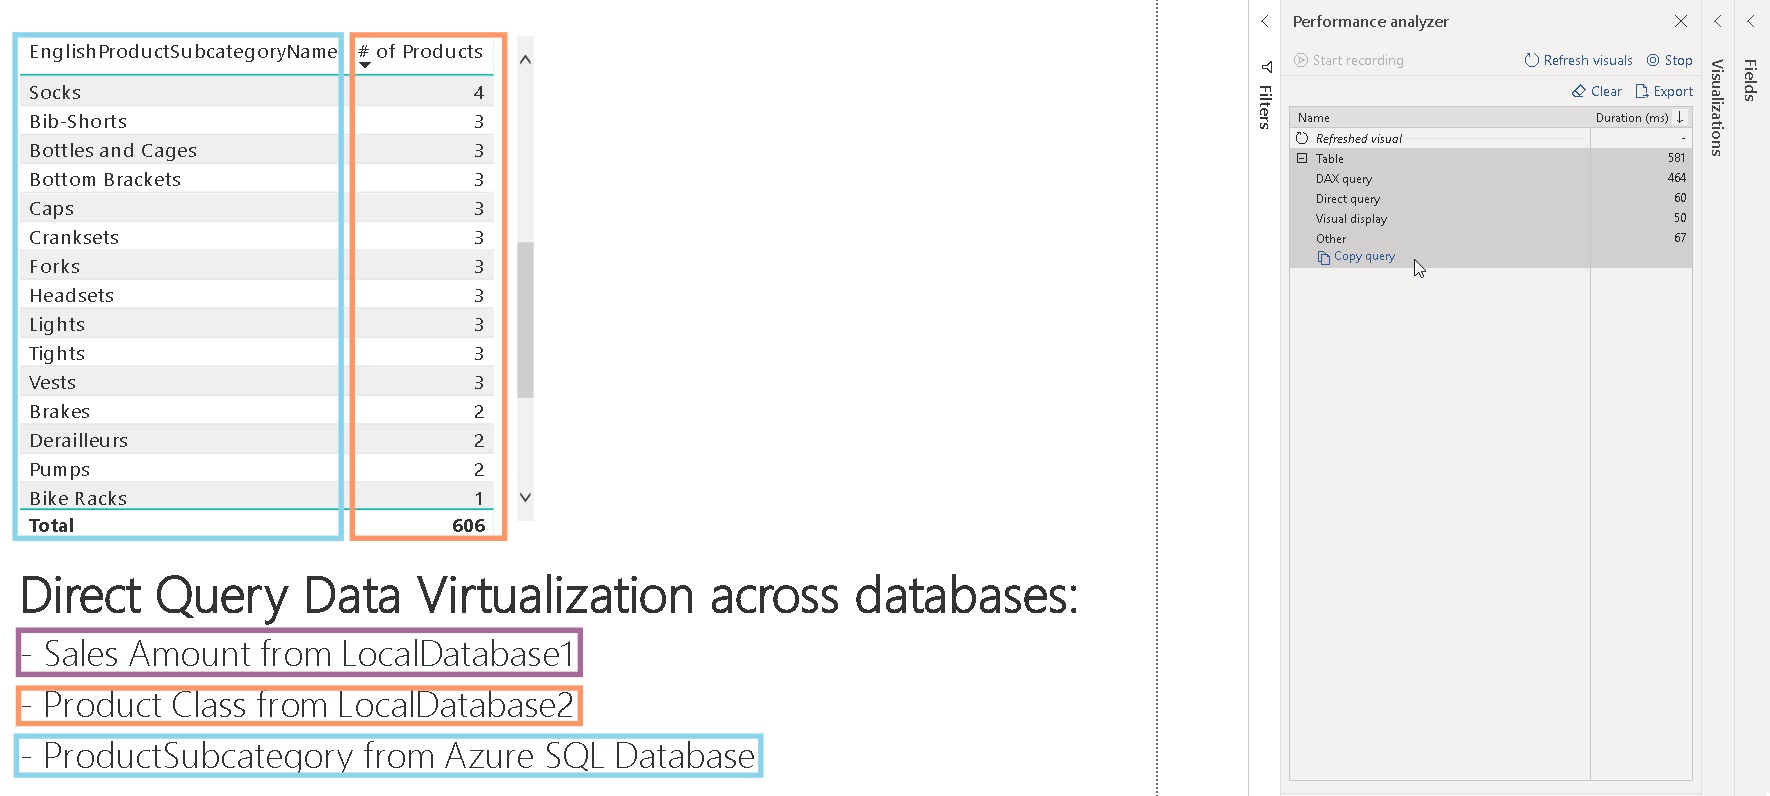
Even though this query only touches two different data sources, it is a good way to analyze the queries sent to the data sources. To track these queries I used the built-in Performance Analyzer of Power BI desktop which can be enabled on the “View”-tab. It gives you detailed information about the performance of the report including the actual SQL queries (under “Direct query”) which were executed on the data sources. The plain text queries can also be copied using the “Copy queries” link at the bottom. In our case 3 SQL queries were executed against 2 different SQL databases:

Query 1:

SELECT TOP (1000001) 
     [t2].[ProductSubcategoryKey],
     [t2].[ProductSubcategoryName]
FROM 
     (
         (
             select 
                 [_].[ProductSubcategoryKey] as [ProductSubcategoryKey],
                 [_].[ProductSubcategoryAlternateKey] as [ProductSubcategoryAlternateKey],
                 [_].[EnglishProductSubcategoryName] as [ProductSubcategoryName],
                 [_].[SpanishProductSubcategoryName] as [SpanishProductSubcategoryName],
                 [_].[FrenchProductSubcategoryName] as [FrenchProductSubcategoryName],
                 [_].[ProductCategoryKey] as [ProductCategoryKey]
             from [dbo].[DimProductSubcategory] as [_]
         )
     ) AS [t2]
GROUP BY 
     [t2].[ProductSubcategoryKey],
     [t2].[ProductSubcategoryName] 

Result:
Results_Query1

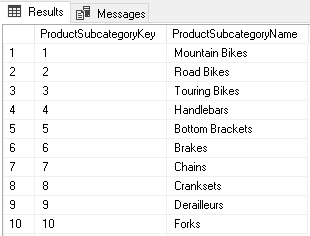
The query basically selects two columns from the DimProductSubcategory table:

  1. ProductSubcategoryKey – which is used in the join with DimProduct
  2. ProductSubcategoryName – which is the final name to be displayed in the visual

The inner sub-select (line 7-14) represents the original Power Query query. It selects all columns from the DimProductSubcategory table and renames [EnglishProductSubcagetoryName] to [ProductSubcategoryName] (line 10). Any other Power Query steps that are supported in direct query like aggregations, groupings, filters, etc. would also show up here.

Query 2 (shortened):

SELECT TOP (1000001) 
     [semijoin1].[c67],
     SUM([a0]) AS [a0]
FROM 
     (
         (
             SELECT 
                 [t1].[ProductSubcategoryKey] AS [c29],
                 COUNT_BIG(*) AS [a0]
             FROM 
             (
                 (
                     select 
                         [$Table].[ProductKey] as [ProductKey],
                         [$Table].[ProductAlternateKey] as [ProductAlternateKey],
                         …
                     from [dbo].[DimProduct] as [$Table]
                 )
             ) AS [t1]
             GROUP BY [t1].[ProductSubcategoryKey]
     ) AS [basetable0]
inner join 
     (
         (SELECT N'Mountain Bikes' AS [c67],1 AS [c29] )  UNION ALL 
         (SELECT N'Road Bikes' AS [c67],2 AS [c29] )  UNION ALL 
         (SELECT N'Touring Bikes' AS [c67],3 AS [c29] )  UNION ALL 
         (SELECT N'Handlebars' AS [c67],4 AS [c29] )  UNION ALL 
         (SELECT N'Bottom Brackets' AS [c67],5 AS [c29] )  UNION ALL 
         …
         (SELECT null AS [c67],null AS [c29] ) 
     ) AS [semijoin1] 
     on [semijoin1].[c29] = [basetable0].[c29]
)
GROUP BY [semijoin1].[c67] 

(The query was shortened at line 16 and line 29 as the removed columns/rows are not relevant for the purpose of this example.)

Similar to Query 1 above, the innermost sub-select (line 13-17) in the FROM clause returns the results of the Power Query query for DimProduct whereas the outer sub-select (line 7-20) groups the result by the common join-key [ProductSubcategoryKey].
This result is then joined with a static table which is made up from hard-coded SELECTs and UNION ALLs (line 24-30). If you take a closer look, you will realize that this table actually represents the original result of Query 1! Additionally it also includes a special NULL-item (line 30) that is used to handle non-matching entries.
The last step is to group the joined tables to obtain the final results.

Query 3 (shortened):

SELECT 
     COUNT_BIG(*) AS [a0]
FROM 
     (
         (
             select 
                 [$Table].[ProductKey] as [ProductKey],
                 [$Table].[ProductAlternateKey] as [ProductAlternateKey],
                 …
             from [dbo].[DimProduct] as [$Table]
         )
     ) AS [t1] 

(The query was shortened at line 9 as the removed columns/rows are not relevant for the purpose of this example.)

The last query is necessary to display the correct grand total across all products and product sub-categories.

As you can see, most of the “magic” happens in Query 2. The virtual join or virtualization is done by hard-coding the results of the remote table/data source directly into the SQL query of the current table/data source. This works fine as long as the results of the remote query are small enough – both, in terms of numbers of rows and columns – but the more limiting factor is the number of rows. Roughly speaking, if you have more than thousand items that are joined this way, the queries tend to get slow. In reality this will very much depend on your data so I would highly recommend to test this with your own data!

I ran a simple test and created a join on the SalesOrderNumber which has about 27,000 distinct items. The query never returned any results and after having a look at the Performance Analyzer I realized, that the query similar to Query 2 above was never executed. I do not know yet whether this is because of the large number of items and the very long SQL query that is generated (27,000 times SELECT + UNION ALL !!!) or a bug.

At this point you may ask yourself if it makes sense to use Power BI for data virtualization or use another tool that was explicitly designed for this scenario. (Just google for “data virtualization”). These other tools may perform better even on higher volume data but they will also reach their limits if the joins get too big and, what is even more important, the are usually quite expensive.

So I think that Power BI is still a viable solution for data virtualization if you keep the following things in mind:
– keep the items in the join columns at a minimum
– use Power Query to pre-aggregate the data if possible
– don’t expect too much in terms of performance
– only use it when you know what you are doing 🙂

Downloads:

PowerBI_DataVirtualization_Part2.pbix
SQL_Query1.sql
SQL_Query2.sql
SQL_Query3.sql

Data Virtualization in Microsoft Power BI

Data Virtualization is actually a very new topic to me as I have barely seen it implemented in the real world or at any of my customers. But it becomes more and more interesting when working with big data where you cannot simply load all data into a single in-memory data model but still need to query across different data sources. So I decided to investigate how this could be done with my favorite reporting tool Power BI which I know is capable to connect to different data sources out of the box and also provides a rich set of visualizations that I need.

But let’s start slowly.

What is Data Virtualization?

According to Wikipedia, “Data virtualization is any approach to data management that allows an application to retrieve and manipulate data without requiring technical details about the data, such as how it is formatted at source, or where it is physically located,[1] and can provide a single customer view (or single view of any other entity) of the overall data.”

So basically, combining data from multiple sources and multiple formats into a common semantic layer which can be queried on-the-fly without the need of any ETL/ELT.

Sounds awesome – right?

The problem is that in reality the things are not as simple as they may sound, especially when it comes to joining across the different sources. While data virtualization usually works fine for small amounts of data that can be easily processed, it can be quite challenging  on large amounts of data which is where data virtualization would actually make sense to avoid lengthy and costly ETL/ELT.

What does Power BI have to do with this?

At first sight – nothing. But lets examine what we currently have in Power BI:

  • a semantic layer and data modelling capabilities
  • access to various data sources via Direct Query (remember, we do not want to load any data!)
  • ability to combine data from those sources

The last part is the most important one here and you may wonder what I am talking about. And you are right, by default a DQ model is only linked to one data source at a time but you can add other data sources manually in the Power Query editor!
This is where it get’s interesting and what this blog post is about.

Test-Case

To verify the statements from above I built a little test case that involves 2 local database and an Azure SQL database over which I want to create a semantic layer using Power BI. All three databases are actually the same AdventureWorksDW databases but for the purpose of this demonstration this is OK as it is just a technical feasibility study.

I started by creating a new Power BI file and connected it to my first data base in Direct Query mode.

Then I selected a single table, in my case I have chosen “FactResellerSales”.

The next step is to add a new table using the “Edit Queries” button on the ribbon:

EditQueries_AddNewDatasources

You will see the one table you have just selected before as a Power Query query which you can simply copy and rename. I renamed it to “DimProduct” as I want to load the DimProduct table from my second local database which can be accomplished by simply changing the connection to the SQL database in the first step “Source” of the query (I use my second local database AdventureWorksDW2014 – instead of AdventureWorksDW2012):

Several things to point out here:

ChangeLocalDatabaseAndTable
  1. once you change the name of the server or the database, you may get prompted for credentials
  2. when you click on Table in the Data column, Power BI asks you if you want to replace the next step – simply press [Yes]
  3. at the “Source” step, Power BI will complain that the results of the current steps are not valid in Direct Query mode – this is fine as the final result will be in the next step (“Navigation”)

I repeated the same procedure again and also added the table “DimProductSubcategory” from my Azure SQL database.
So right now we have 3 Direct Query tables pointing to 3 different databases and 3 different tables.

Setup_Relationships

Now we need to connect our tables in the Relationship-view – similar as you would to with any other tables in a regular Direct Query setup:

Once the relationships are created, we can finally create our reports.

Are you excited? Well, I definitely was when I tried this setup the first time!

InteractiveReport

The visuals behave as if they were created on top of an Import Mode dataset or a Direct Query dataset that only connects to a single database. I think that is pretty awesome and again shows what Power BI is capable of!

We just used Power BI to create a semantic layer across different databases and tables which are now all joined and queried on-the-fly always showing the most recent data!

Conclusion

As you have seen, you Power BI allows us to combine multiple SQL databases in Direct Query mode and query them together as if they would be one single data source. So if you have a requirement where your data is distributed across databases and you it is too big to be loaded into memory or you need live data, you can give this approach a try. I have only tested it with regular Microsoft SQL databases but I assume that this works in a similar way with any other data source that supports Direct Query (e.g. SAP, Oracle, Spark, …) too. You can also do some basic transformations before joining the data in Direct Query mode which can also be very crucial when combining different data sources that might have slightly different formats. Again, I have not tested this thoroughly but at least everything that can be query folded should be  supported as a transformation.

In a follow-up post I will explain the technical details and what actually happens in the background when you use a setup like this so stay tuned!

Power BI – Dynamic TopN + Others with Drill-Down

A very common requirement in reporting is to show the Top N items (products, regions, customers, …) and this can also be achieved in Power BI quite easily.

But lets start from the beginning and show how this requirement usually evolves and how to solve the different stages.

The easiest thing to do is to simply resize the visual (e.g. table visual) to only who 5 rows and sort them descending by your measure:

This is very straight forward and I do not think it needs any further explanation.

The next requirement that usually comes up next is that the customer wants to control, how many Top items to show. So they implement a slicer and make the whole calculation dynamic as described here:
SQL BI – Use of RANKX in a Power BI measure
FourMoo – Dynamic TopN made easy with What-If Parameter

Again, this works pretty well and is explained in detail in the blog posts.

Once you have implemented this change the business users usually complain that Total is wrong. This depends on how you implemented the TopN measure and what the users actually expect. I have seen two scenarios that cause confusion:
1) The Total is the SUM of the TopN items only – not reflecting the actual Grand Total
2) The Total is NOT the SUM of the TopN items only – people complaining that Power BI does not sum up correctly

As I said, this pretty much depends on the business requirements and after discussing that in length with the users, the solution is usually to simply add an “Others” row that sums up all values which are not part of the TopN items. For regular business users this requirement sounds really trivial because in Excel the could just add a new row and subtract the values of the TopN items from the Grand Total.

However, they usually will not understand the complexity behind this requirement for Power BI. In Power BI we cannot simply add a new “Others” row on the fly. It has to be part of the data model and as the TopN calculations is already dynamic, also the calculation for “Others” has to be dynamic. As you probably expected, also this has been covered already:
Oraylis – Show TopN and rest in Power BI
Power BI community – Dynamic Top N and Others category

These work fine even if I do not like the DAX as it is unnecessarily complex (from my point of view) but the general approach is the same as the one that will I show in this blog post and follows these steps:
1) create a new table in the data model (either with Power Query or DAX) that contains all our items that we want to use in our TopN calculation and an additional row for “Others”
2) link the new table also to the fact table, similar to the original table that contains your items
3) write a measure that calculates the rank for each item, filters the TopN items and assigns the rest to the “Others” item
4) use the new measure in combination with the new table/column in your visual

Step 1 – Create table with “Others” row

I used a DAX calculated table that does a UNION() of the existing rows for the TopN calculation and a static row for “Others”. I used ROW() first so I can specify the new column names directly. I further use ALLNOBLANKROW() to remove to get rid of any blank rows.

Subcategory_wOthers = UNION(
ROW("SubcategoryKey_wOthers", -99, "SubcategoryName_wOthers", "Others"), 
ALLNOBLANKROW('ProductSubcategory'[ProductSubcategoryKey], 'ProductSubcategory'[SubcategoryName])
) 

Step 2 – Create Relationship

The new table is linked to the same table to which the original table was linked to. This can be the fact-table directly or an intermediate table that then filters the facts in a second step (as shown below)

Step 3 – Create DAX measure

That’s actually the tricky part about this solution, but I think the code is still very easy to read and understand:

Top Measure ProductSubCategory =  
/* get the items for which we want to calculate TopN + Others */ 
VAR Items = SELECTCOLUMNS(ALL(Subcategory_wOthers), "RankItem", Subcategory_wOthers[SubcategoryName_wOthers]) 
/* add a measure that we use for ranking */ 
VAR ItemsWithValue = ADDCOLUMNS(Items, "RankMeasure", CALCULATE([Selected Measure], ALL(ProductSubcategory))) 
/* add a column with the rank of the measure within the items */ 
VAR ItemsWithRank = ADDCOLUMNS(ItemsWithValue, "Rank", RANKX(ItemsWithValue, [RankMeasure], [RankMeasure], DESC, Dense)) 
/* calculate whether the item is a Top-item or belongs to Others */ 
VAR ItemsWithTop = ADDCOLUMNS(ItemsWithRank, "TopOrOthers", IF([Rank] <= [Selected TopN], [RankItem], "Others")) 
/* select the final items for which the value is calculated */ 
VAR ItemsFinal = SELECTCOLUMNS( /* we only select a single column to be used with TREATAS() in the final filter */
     FILTER(
         ItemsWithTop, 
         CONTAINSROW(VALUES(Subcategory_wOthers[SubcategoryName_wOthers]), [TopOrOthers]) /* need to obey current filters on _wOthers table. e.g. after Drill-Down */
         && CONTAINSROW(VALUES(ProductSubcategory[SubcategoryName]), [RankItem])), /* need to obey current filters on base table */ 
     "TopN_Others", [RankItem]) 
RETURN      
CALCULATE(
    [Selected Measure], 
    TREATAS(ItemsFinal, Subcategory_wOthers[SubcategoryName_wOthers])
)

Step 4 – Build Visual

One of the benefits of this approach is that it also allows you to use the “Others” value in slicers, for cross-filtering/-highlight and even in drill-downs. To do so we need to configure our visual with two levels. The first one is the column that contains the “Others” item and the second level is the original column that contains the items. The DAX measure will take care of the rest.

And that’s it! You can now use the column that contains the artificial “Others” in combination with the new measure wherever you like. In a slicer, in a chart or in a table/matrix!

The final PBIX workbook can also be downloaded: TopN_Others.pbix

Using Power BI Desktop Direct Query with Parameters

I frequently work on projects where we have multiple tiers on which our solution is deployed to using continuous integration / continuous deployment (CI / CD) pipelines in Azure DevOps. Once everything is deployed, you also need to monitor these different environments and check the status of the data or ETL pipelines. My tool of choice is usually Power BI desktop as it allows me to connect to e.g. SQL databases very easily. However, I always ended up creating a multiple Power BI files – one for each environment.

Having multiple files results in a lot of overhead when it comes to maintenance and also managing these files. Fortunately, I came across this little trick when I was investigating in composite models and aggregations that I am going to explain in this blog post.

To be honest, I barely used Power BI Direct Query in past and so maybe this feature has been there for quite some time without me realizing it but It may also be that it was introduced just recently with composite models.
So the “feature” is, that you can also use Query Parameters to parameterize your Direct Query queries. This is pretty awesome if you think of it for a second:

  • easy switching between databases
  • use one file for all environments
  • only maintain a single file
  • no need to import/load any data

Power BI DirectQuery with Parameters

The configuration within Power Query is also quite easy – simply replacing the hard coded values with the ones from the parameters:

Power Query configuration using Parameters instead of hard-coded values

And that’s it already! you can now easily switch between different databases by just using Power BI parameters and the Direct Query connection will change automatically to the new server/database.
Of course, all the target servers/databases have to have the same schema otherwise, you will get an error.

Caveats:
Even though this looks quite trivial, there are some caveats which makes me believe this is not fully supported yet. You may noticed above already that in Power Query, when going to the step that actually queries the database, it complains about that this step would cause the whole table to be converted to Import Mode. However, you can just ignore it and go on with the next step to remain in Direct Query Mode.

Ignore warning and DO NOT convert to Import Mode

It seems like Power BI keeps track from where a table was originally imported. So if you want to add a new table, make sure to copy an existing Direct Query table and change it accordingly instead of going to “New Source > …” !

Also, you need to make sure that you have entered the credentials for the different source databases at least once – otherwise Power BI will ask you when you query the database the first time. This is also the reason why this does not work so well in the Power BI service as changing the parameters there is not as simple as it is in Power BI desktop.

As I said, I do not know if this is a new feature (or a feature at all), but it is definitely helpful for certain scenarios.

Downloads:
Power BI Workbook: DirectQuery_wParameters.pbix

Showing OLAP UniqueNames in PowerBI

I just had the request to expose the UniqueNames of an Analysis Services Multidimensional cube in PowerBI. You may ask why I would want to do this and the answer is actually pretty simple: In SSAS MD the caption of elements/members even within the same attribute is not necessarily unique. This is because of the Key/Name concept where the elements/members are grouped by the Key but for the end-user a proper Name is displayed. So if you happen to have duplicate Names in your cube, import the values into PowerBI you will end up with less rows (and wrong values!) compared to the original SSAS MD cube because PowerBI (and also Analysis Services Tabular) does not have a Key/Name concept and therefore the grouping and what is display is always the same.

Having worked quite a lot with SSAS MD in the past I knew that every attribute member contains various internal properties, one of them being the UniqueName, which, as the name implies, is the unique identifier for each member regardless of the caption displayed for that member. And that’s exactly what I needed in this scenario. So the question is how to get this information in PowerBI as this is nothing that should usually be exposed to an end-user.

There is very little information in the internet about SSAS MD connectivity with PowerBI for in general (talking about the import-mode here and not the live-connection!).
One of the few blog posts I found from Chris Webb is already 3 years old: https://blog.crossjoin.co.uk/2015/01/13/a-closer-look-at-power-queryssas-integration/. The other resource is the official documentation on MSDN (scroll down to the “Cube” functions): https://msdn.microsoft.com/en-us/query-bi/m/accessing-data-functions which does not really provide a lot of information except for the syntax of the functions.

Anyway, I started to dig into this topic and made some this. Basically this is what I want to achieve:
PowerQuery_Cube_AttributeMemberId_Output

For my sample I used to Adventure Works MD cube, opened it in PowerBI using Import-Mode and just selected the [Product].[Subcategory] hierarchy:
PowerQuery_Cube_Transform_Product_Subcategory

The UI is quite limited here and you can only select hierarchies and measures.
However, getting the UniqueName of a given hierarchy can be achieved quite easily in a subsequent step by adding a new custom column:
PowerQuery_Cube_AttributeMemberId

And that’s already all you need to do. The column [Product.Subcategory] contains various information, one of them being the UniqueName of the product subcategory which can be accessed by the Cube.AttributeMemberId function.

My next step was to try to get some other properties in a similar way using the Cube.AttributeMemberProperty function. According to the documentation it is quite similar to Cube.AttributeMemberId but takes an additional parameter where you can define which property you want to retrieve. As the [Product].[Subcategory] hierarchy has a property called “Category” I tried this:
PowerQuery_Cube_AttributeMemberProperty

This caused a huge error in PowerBI desktop and so I tried different styles to define the property:

  • “Category”
  • “[Category]”
  • “[Product].[Subcategory].[Subcategory].[Category]”

I also tried to access internal properties:

  • “MEMBER_KEY”
  • “CAPTION”
  • “UNIQUE_NAME”

None of these worked though, neither for the regular properties nor for the internal ones. The main problem seems to be that the MDX query executed does not query any other properties except for the UniqueName not even if you specify them manually in your PowerQuery script. This means that so far there is no way to access member properties from within PowerBI. There is already a user voice where you can vote for this: https://ideas.powerbi.com/forums/265200-power-bi-ideas/suggestions/12443955-member-properties-ssas

Download: PowerBI_UniqueNames.pbix
This PowerBI Desktop model contains all samples from above including the my failed tries for the properties!

Storing Images in a PowerBI/Analysis Services Data Models

As some of you probably remember, when PowerPivot was still only available in Excel and Power Query did not yet exist, it was possible to load images from a database (binary column) directly into the data model and display them in PowerView. Unfortunately, this feature did not work anymore in PowerBI Desktop and the only way to display images in a visual was to provide the URL of the image which is public accessible. The visual would then grab the image on-the-fly from the URL and render it. This of course has various drawbacks:

  • The image needs to be available via a public URL (e.g. upload it first to an Azure Blob Store)
  • The image cannot be displayed when you are offline
  • The link may break in the future or point to a different image as initially when the model was built

There is also a  feedback items about this issue which I encourage you to vote for: https://ideas.powerbi.com/forums/265200-power-bi-ideas/suggestions/7340150-data-model-image-binary-support-in-reports

Until today I was sure that we have to live with this limitation but then I came across this blog post from Jason Thomas aka SqlJason. He shows a workaround to store images directly in the PowerBI data model and display them in the report as if they were regular images loaded from an URL. This is pretty awesome and I have to dedicate at least 99.9% of this blog post to Jason and his solution!

However, with this blog post I would like to take Jasons’ approach a step further. He creates the Base64 string externally and hardcodes it in the model using DAX. This has some advantages (static image, no external dependency anymore, …) but also a lot of disadvantages (externally create the Base64 string, manually copy&paste the Base64 string for each image, hard to maintain, cannot dynamically add images …). For scenarios where you have a local folder with images, a set of [private] URLs pointing to images or images stored in a SQL table (as binary) which you want to load into your PowerBI data model, this whole process should be automated and ideally done within PowerBI.

PowerBI_Images_Stored_Sample

Fortunately, this turns out to be quite simple! Power Query provides a native function to convert any binary to a Base64 encoded string: Binary.ToText() . The important part to point out here is to use the second parameter which allows you to set the encoding of the resulting text. It supports two values: BinaryEncoding.Base64 (default) and BinaryEncoding.Hex. Once we have the Base64 string, we simply need to prefix it with the following meta data: “data:image/jpeg;base64, “

To make it easy, I wrote to two custom PowerQuery functions which convert and URL or a binary image to the appropriate string which can be used by PowerBI:

let
    UrlToImage = (ImageUrl as text) as text =>
let
    BinaryContent = Web.Contents(ImageUrl),
    Base64 = "data:image/jpeg;base64, " & Binary.ToText(BinaryContent, BinaryEncoding.Base64)
in
    Base64
in
    UrlToImage
let
    BinaryToPbiImage = (BinaryContent as binary) as text=>
let
    Base64 = "data:image/jpeg;base64, " & Binary.ToText(BinaryContent, BinaryEncoding.Base64)
in
    Base64
in
    BinaryToPbiImage

If your images reside in a local folder, you can simply load them using the “Folder” data source. This will give you a list of all images and and their binary content as separate column. Next add a new Custom Column where you call the above function to convert the binary to a prefixed Base64 string which can then be displayed in PowerBI (or Analysis Services) as a regular image. Just make sure to also set the Data Category of the column to “Image URL”:PowerBI_Image_URL_Base64

And that’s it, now your visual will display the image stored in the data model without having to access any external resources!

Caution: As Jason also mentions at the end of his blog post, there is an internal limitation about the size of a text column. So this may cause issues when you try to load high-resolution images! In this case, simply lower the size/quality of the images before you load them.
UPDATE May 2019: Chris Webb provides much more information and a solution(!) to this issue in his blog post: https://blog.crossjoin.co.uk/2019/05/19/storing-large-images-in-power-bi-datasets

Download: StoreImageInPbiModel.pbix
This PowerBI Desktop model contains all samples from above including the PowerQuery functions!

Upgrading your reports from PowerBI to Azure Analysis Services

Since April 2017 it is possible to build reports on top of datasets that are hosted in the PowerBI service. This was announced and described here and here in more detail. This might not seem like a big deal at first sight, but it can have a huge impact on how you work with PowerBI. By separating the data model from the report, you can have two or more independent people working with the same dataset. Also, the people who build the reports in the end most not necessarily have the knowledge to build a data model – the just need to use it. So, there are some clear advantages when you split up your workbook:

  • separation of duty (data modeler vs. report builder)´
  • any number of reports on top of the same model
  • easy control over reports as the files are quite small (they only contain the definition of the report)

This is all pretty cool and, from my point of view, the way to go once you want to use the reports in production and/or have several people working on/with the same reports.

But lets go a step further. After some time, as your data model grows, you realize that the reports get slow and also the processing takes a considerable amount of time to finish. The official upgrade path will then guide you to Azure Analysis Services and you will migrate your data model to deal with the larger data volumes and make use of the flexibility in processing you gained by your upgrade. This migration process is very well described here.

So far so good, but what happens to your reports? Last week I was in exactly the position described above and we had to migrate the existing reports (which were base on a dataset hosted in PowerBI) to Azure Analysis Services. As of now, there is now simple way to simply change the connection string from PowerBI to Azure Analysis Services neither in PBI Desktop nor in the Service. But we could think of some options how it might work:

  • rebuild all reports
  • use the REST API to update the connection string of the existing reports
  • modify the .pbix file manually (NOT OFFICIALLY SUPPORTED)

As you can imagine, rebuilding all reports was not really an option.

The next option, the PowerBI REST API looked pretty promising at first sight. It allows you to retrieve and set the dataset that is used by your report. So the idea is to simply create a new dataset which points to Azure Analysis Services in Live Query mode, take the existing report and use the Rebind API call to bind it to the new AAS dataset. Even though this is supposed to work, I could not make it work in my environment. I tried all things that I could think of but nothing work and I also gave up on this.

So I was stuck there but knew that the information of the data source has to be somewhere in the .pbix file. In the past I already did something similar with Excel/PowerPivot files (“Restoring a SSAS Tabular model to PowerPivot”) so I thought I would also give it a try for .pbix files. And it turns out that they are quite similar. For those of you who are new to this, most (if not all) of the files that are associated with a Microsoft tool and end with “x” (e.g. .xlsx/docx/…) are just ZIP-files in the end. To unzip them, simply rename them to .zip and use your favorite zip-tool to open them. You will see a file-structure similar to the one below:
pbix zip file content

(If your file contains a data model, you see a file called “DataModelSchema” instead of “Connections”. The next steps will not work in this case!). However, in our case, as the report is linked to a dataset hosted in the PowerBI service, our file does not contain any data itself but only the connection information to our data source. As you can guess, this information is stored in the “Connections” file.

To see what a connection to an Azure Analysis Services dataset looks like, I simply created a new PowerBI desktop model and established a Live Connection. Saved it and opened it again as zip file. The Connection file itself is just a JSON but the details are not really relevant here. I simply replaced the Connections file from my original report with the one from my new workbook linked to AAS. Renamed it back to pbix, opened it and voilà, my report was connected to AAS!

This saved us a lot of time and we could move all of our reports within a couple of hours!

Please keep in mind, that this is not officially supported and might break your model. So make sure to always create a backup before you modify the contents of a pbix file manually!
I do not take any responsibility for any broken models or anything else that might happen!

Refresh PowerBI Datasets using PowerShell and Azure Runbooks

In June 2017, Microsoft announced a new set of API function to manage data refreshes in PowerBI. The new API basically allows you to trigger a refresh or retrieve the history of previously executed refreshes. The full specification can be found in the official MSDN documentation, or using this direct links: Refresh dataset and Get dataset refresh history

So besides the scheduled and manual refreshes from within the PowerBI service directly, we now have a third option to trigger refreshes but this time also from an external caller! This itself is already pretty awesome and some people already did some cool stuff leveraging the new API functions:

Charles Sterling: Running the Power BI Refresh API’s Headless
Sirui Sun: Git-Repository powerbi-powershell

The basic idea is to use object from pre-built Azure Management DLLs to generate the OAuth Access token that is necessary to use the API. This works very well locally but cannot be used in the cloud – e.g. in combination with Azure Automation Runbooks or Azure Functions where you cannot install or reference any custom DLLs.

In this blog post I will show you how you can accomplish exactly this  – create an Azure Automation Runbook to refresh your PowerBI dataset!
But first of all there are some things that you need to keep in mind:

  1. There are no service accounts in PowerBI so we will always use a “real” user
  2. you need to supply the credentials of a “real” user
  3. The user needs to have appropriate access to the dataset in order to refresh it
  4. the dataset refresh must succeed if you do it manually in PowerBI
  5. you are still limited to 8 refreshes/day through the API

OK, so lets get started. First of all we need an Azure Application which has permissions in PowerBI. The easiest way to do this is to use the navigate to https://dev.powerbi.com/apps, log in with your account and simply follow the steps on the screen. The only import thing is to select the App Type “Native app”. At the end, you will receive a ClientID and a ClientSecret – Please remember the ClientID for later use!

Next step is to create the Azure Runbook. There are plenty of tutorials out there on how to do this: My first PowerShell workflow runbook or Creating or importing a runbook in Azure Automation so I will no go into much more detail here. Besides the runbook itself you also need to create an Automation Credential to store the username and password in a secure way – here is a tutorial for this: Credential Assets in Azure Automation

Now lets take a look at the PowerShell code. Instead of using any pre-built DLLs I removed all unnecessary code and do all the communication using Invoke-RestMethod. This is a very low-level function and is part of the standard PowerShell modules so there is no need to install anything! The tricky part is to acquire an Authentication Token using username/password as it is nowhere documented (at least I could not find it) what the REST call has to look like. So I used Fiddler to track the REST calls that the pre-built DLLs use and rebuilt them using Invoke-RestMethod. This is what I came up with:

$authUrl = "https://login.windows.net/common/oauth2/token/"
$body = @{
"resource" = "https://analysis.windows.net/powerbi/api";
"client_id" = $clientId;
"grant_type" = "password";
"username" = $pbiUsername;
"password" = $pbiPassword;
"scope" = "openid"
}
$authResponse = Invoke-RestMethod -Uri $authUrl –Method POST -Body $body

$clientId is the ClientID of the Azure AD Application
$pbiUsername is the email address of the PowerBI user.
$pbiPassword is the password of the PowerBI user.
The $authRepsonse then contains our Authentication token which we can use to make our subsequent calls:

$restURL = "https://api.powerbi.com/v1.0/myorg/datasets/$pbiDatasetId/refreshes"
$headers = @{
"Content-Type" = "application/json";
"Authorization" = $authResponse.token_type + " " + $authResponse.access_token
}
$restResponse = Invoke-RestMethod -Uri $restURL –Method POST -Headers $headers

And that’s all you need. I wrapped everything into a PowerShell function that can be used as an Azure Runbook. The username/password is derived from an Azure Automation Credential.

The final runbook can be found here: PowerBI_Refresh_Runbook.ps1

Refresh_PowerBI_Dataset_Azure_Runbook

It takes 4 Parameters:

  1. CredentialName – the name of the Azure Automation credential that you created and which stores the PowerBI username and password
  2. ClientID – the ID of your Azure Active Directory Application which you created in the first step
  3. PBIDatasetName – the name of the PowerBI dataset that you want to refresh
  4. PBIGroupName – (optional) the name of the group/workspace in which the PowerBI dataset from 3) resides

When everything is working as expected, you can create custom schedules or even create webhooks to trigger the script and refresh you PowerBI dataset! As you probably know, this is really powerful as you can now make the refresh of the PowerBI dataset part of your daily ETL job!

C# Wrapper for Power BI REST API – Version 2

Some time ago, when Microsoft released the first version of Power BI Rest API I already wrote a wrapper for C# which allowed you to map the object from the API into regular C# objects and work with them locally. However, there have been some major upgrades since then (Actually they were already announced in July 2016 but I did not find anytime to work on this again until now Smile ). Anyway, I just published a new version of my C# wrapper on my GitHub site: https://github.com/gbrueckl/PowerBI.API.Client

To use it, you first need to create an Azure AD application and get an ApplicationID – this is very well described here or can be done directly at https://dev.powerbi.com/apps

A new PowerBI API Client object can then be created using the ApplicationID:

Create a PowerBI API Client
PBIAPIClient pbic = new PBIAPIClient(ApplicationID);

Basically, most of the features described in the API reference are also included in the API Wrapper. So you can now use C# to create your PowerBI model locally and deploy it to the PowerBI service! The only to keep in mind is that the dataset you create via the API can only be sourced by pushing data into it using the Push/Streaming API. As this can be quite cumbersome sometimes, I also added the functionality to publish a whole C# DataTable with basically just two lines of code to publish your reference data/dimensions:

Publish DataTable to PowerBI
// create a regular DataTable – but could also be derived from a SQL Database!
DataTable dataTable = new DataTable();
/* populate the dataTable */
// create a PBI table from a regular DataTable object
PBITable productsTable = new PBITable(dataTable);
// publish the table and push the rows from the dataTable to the PowerBI table
productsTable.PublishToPowerBI(true);


This snippet basically deploys the table structure to the PowerBI service and populates it with data from the DataTable:
Published_DataTable


For your “fact”-data you can also create single rows on your own using the PBIRow-object and publish them manually e.g. for WriteBack-scenarios:

Publish Rows to PowerBI
salesTable.DeleteRowsFromPowerBI();
PBIRow row = salesTable.GetSampleRow();
row.SetValue("ProductKey", 1);
row.SetValue("SalesDate", DateTime.Now);
row.SetValue("Amount_BASE", 100);
salesTable.PushRowToPowerBI(row);

Depending on the type of DataSet you choose (Push, PushStreaming or Streaming), you can also create DAX Measures or Relationships:

Add Measures and Relationships
salesTable.Measures.Add(new PBIMeasure("Sales Amount", "SUM('{0}'[{1}])", tableNameFacts, "Amount_BASE")); // adding a measure
dataset.Relationships.Add(new PBIRelationship("MyRelationship", salesTable.GetColumnByName("ProductKey"), productsTable.GetColumnByName("ProductKey")));


Of course, all the features that were already supported in the first version, are still supported:

  • Get Embed-URLs of Reports and Tiles
  • List Reports, Dashboards, Datasets, …

The new version also supports Streaming and PushStreaming datasets in the same way as it does for regular Push datasets. For details on Streaming datasets please take a look at Real-time streaming in PowerBI

I recommend to explore the API on your own by simply building your first PowerBI Push/Streaming Model on your own!
For the latest features and improvements please refer to the GitHub repository which will be updated frequently.

Any feedback and participation in the further development is highly appreciated and will be done via the GitHub repository.

Monitoring Azure Data Factory using PowerBI

Some time ago Microsoft released the first preview of a tool which allows you to monitor and control your Azure Data Factory (ADF). It is a web UI where you can select your Pipeline, Activity or Dataset and check its execution state over time. However, from my very personal point of view the UI could be much better, especially much clearer(!) as it is at the moment. But that’s not really a problem as the thing I like the most about ADF is that its quite open for developers (for example Custom C#/.Net Activities) and it also offers a quite comprehensive REST API to control an manage it.
For our monitoring purposes we are mainly interested in the LIST interface but we could do basically every operation using this API. In my example I only used the Dataset API, the Slices API and the Pipeline API.

First we start with the Dataset API to get a list of all data sets in our Data Factory. This is quite simple as we just need to build our URL of the REST web service like this:

  1. https://management.azure.com/subscriptions/{SubscriptionID}/resourcegroups/{ResourceGroupName}/providers/Microsoft.DataFactory/datafactories/{DataFactoryName}/datasets?api-version={api-version}

You can get all of this information for the Azure Portal by simply navigating to your Data Factory and checking the URL which will be similar to this one:

  1. https://portal.azure.com/#resource/subscriptions/1234567832324a04a0a66e44bf2f5d11/resourceGroups/myResourceGroup/providers/Microsoft.DataFactory/dataFactories/myDataFactory

So this would be my values for the API Call:
– {SubscriptionID} would be “12345678-3232-4a04-a0a6-6e44bf2f5d11”
– {ResourceGroupName} would be “myResourceGroup”
– {DataFactoryName} would be “myDataFactory”
– {api-version} would be a fixed value of “2015-10-01”

Once you have your URL you can use PowerBI to query the API using Get Data –> From Web
Next you need to authenticate using your Personal or Organizational Account – the same that you use to sign in to the Portal – and also the level for which you want to use the credentials. I’d recommend you to set it either to the subscription level or to the data-factory itself, depending on your security requirements. This ensures that you are not asked for credentials for each different API:
ADF_PowerBI_Authentication

This works in a very similar way also for the Slices API, the Pipeline API and all other APIs available! The other transformations I used are regular PowerQuery/M steps done via the UI so I am not going to describe them in more detail here. Also, setting up the relationships in our final PowerPivot model should be straight forward.

Now that we have all the required data in place, we can start with our report. I used some custom visuals for the calendar view, some slicers and a simple table to show the details. I also used a Sankey Chart to visualize the dependencies between the datasets.

ADF_PowerBI_Monitoring_Dashboard
ADF_PowerBI_Monitoring_Dependencies

Compared to the standard GUI for monitoring this provides a much better overview of slices and their current states and it also allows easy filtering. I am sure there are a lot of other PowerBI visualizations which would make a lot of sense here, these are just to give you an idea how it could look like, but of course you have all the freedom PowerBI offers you for reporting!

The only drawback at the moment is that you cannot reschedule/reset slices from PowerBI but for my monitoring-use-case this was not a problem at all. Also, I did not include the SliceRun API in my report as this would increase the size of the data model a lot, so detailed log information is not available in my sample report.

The whole PowerBI template is available for download on my GitHub site: https://github.com/gbrueckl/Azure.DataFactory.PowerBIMonitor