Power BI – Dynamic TopN + Others with Drill-Down

A very common requirement in reporting is to show the Top N items (products, regions, customers, …) and this can also be achieved in Power BI quite easily.
But lets start from the beginning and show how this requirement usually evolves and how to solve the different stages.

The easiest thing to do is to simply resize the visual (e.g. table visual) to only who 5 rows and sort them descending by your measure:
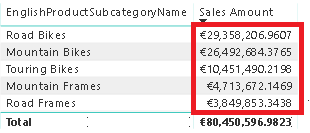
This is very straight forward and I do not think it needs any further explanation.

The next requirement that usually comes up next is that the customer wants to control, how many Top items to show. So they implement a slicer and make the whole calculation dynamic as described here:
SQL BI – Use of RANKX in a Power BI measure
FourMoo – Dynamic TopN made easy with What-If Parameter

Again, this works pretty well and is explained in detail in the blog posts.

Once you have implemented this change the business users usually complain that Total is wrong. This depends on how you implemented the TopN measure and what the users actually expect. I have seen two scenarios that cause confusion:
1) The Total is the SUM of the TopN items only – not reflecting the actual Grand Total
2) The Total is NOT the SUM of the TopN items only – people complaining that Power BI does not sum up correctly

As I said, this pretty much depends on the business requirements and after discussing that in length with the users, the solution is usually to simply add an “Others” row that sums up all values which are not part of the TopN items. For regular business users this requirement sounds really trivial because in Excel the could just add a new row and subtract the values of the TopN items from the Grand Total.

However, they usually will not understand the complexity behind this requirement for Power BI. In Power BI we cannot simply add a new “Others” row on the fly. It has to be part of the data model and as the TopN calculations is already dynamic, also the calculation for “Others” has to be dynamic. As you probably expected, also this has been covered already:
Oraylis – Show TopN and rest in Power BI
Power BI community – Dynamic Top N and Others category

These work fine even if I do not like the DAX as it is unnecessarily complex (from my point of view) but the general approach is the same as the one that will I show in this blog post and follows these steps:
1) create a new table in the data model (either with Power Query or DAX) that contains all our items that we want to use in our TopN calculation and an additional row for “Others”
2) link the new table also to the fact table, similar to the original table that contains your items
3) write a measure that calculates the rank for each item, filters the TopN items and assigns the rest to the “Others” item
4) use the new measure in combination with the new table/column in your visual

Step 1 – Create table with “Others” row

I used a DAX calculated table that does a UNION() of the existing rows for the TopN calculation and a static row for “Others”. I used ROW() first so I can specify the new column names directly. I further use ALLNOBLANKROW() to remove to get rid of any blank rows.

Subcategory_wOthers = UNION(
ROW("SubcategoryKey_wOthers", -99, "SubcategoryName_wOthers", "Others"), 
ALLNOBLANKROW('ProductSubcategory'[ProductSubcategoryKey], 'ProductSubcategory'[SubcategoryName])
) 

Step 2 – Create Relationship

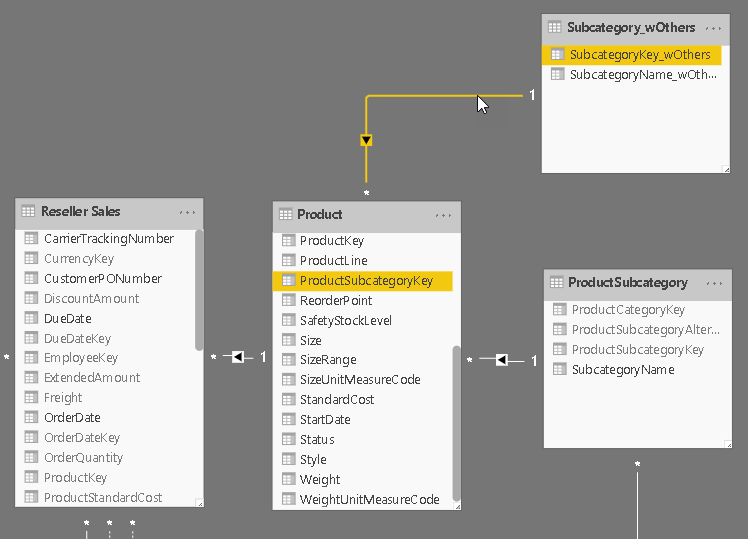
The new table is linked to the same table to which the original table was linked to. This can be the fact-table directly or an intermediate table that then filters the facts in a second step (as shown below)
Step 3 – Create DAX measure

That’s actually the tricky part about this solution, but I think the code is still very easy to read and understand:

Top Measure ProductSubCategory =  
/* get the items for which we want to calculate TopN + Others */ 
VAR Items = SELECTCOLUMNS(ALL(Subcategory_wOthers), "RankItem", Subcategory_wOthers[SubcategoryName_wOthers]) 
/* add a measure that we use for ranking */ 
VAR ItemsWithValue = ADDCOLUMNS(Items, "RankMeasure", CALCULATE([Selected Measure], ALL(ProductSubcategory))) 
/* add a column with the rank of the measure within the items */ 
VAR ItemsWithRank = ADDCOLUMNS(ItemsWithValue, "Rank", RANKX(ItemsWithValue, [RankMeasure], [RankMeasure], DESC, Dense)) 
/* calculate whether the item is a Top-item or belongs to Others */ 
VAR ItemsWithTop = ADDCOLUMNS(ItemsWithRank, "TopOrOthers", IF([Rank] <= [Selected TopN], [RankItem], "Others")) 
/* select the final items for which the value is calculated */ 
VAR ItemsFinal = SELECTCOLUMNS( /* we only select a single column to be used with TREATAS() in the final filter */
     FILTER(
         ItemsWithTop, 
         CONTAINSROW(VALUES(Subcategory_wOthers[SubcategoryName_wOthers]), [TopOrOthers]) /* need to obey current filters on _wOthers table. e.g. after Drill-Down */
         && CONTAINSROW(VALUES(ProductSubcategory[SubcategoryName]), [RankItem])), /* need to obey current filters on base table */ 
     "TopN_Others", [RankItem]) 
RETURN      
CALCULATE(
    [Selected Measure], 
    TREATAS(ItemsFinal, Subcategory_wOthers[SubcategoryName_wOthers])
)

Step 4 – Build Visual

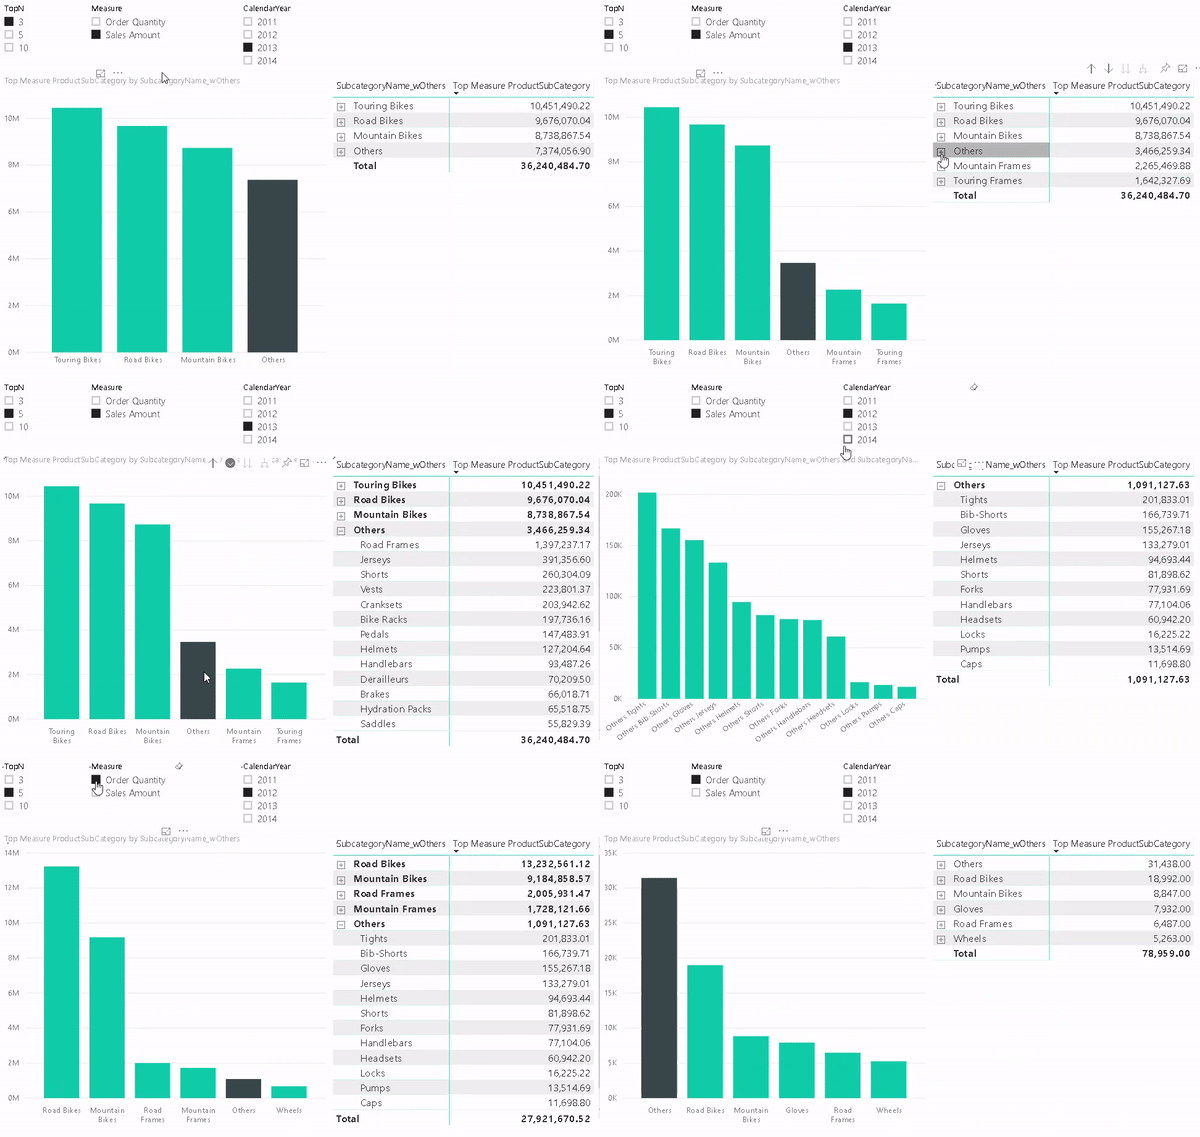
One of the benefits of this approach is that it also allows you to use the “Others” value in slicers, for cross-filtering/-highlight and even in drill-downs. To do so we need to configure our visual with two levels. The first one is the column that contains the “Others” item and the second level is the original column that contains the items. The DAX measure will take care of the rest.
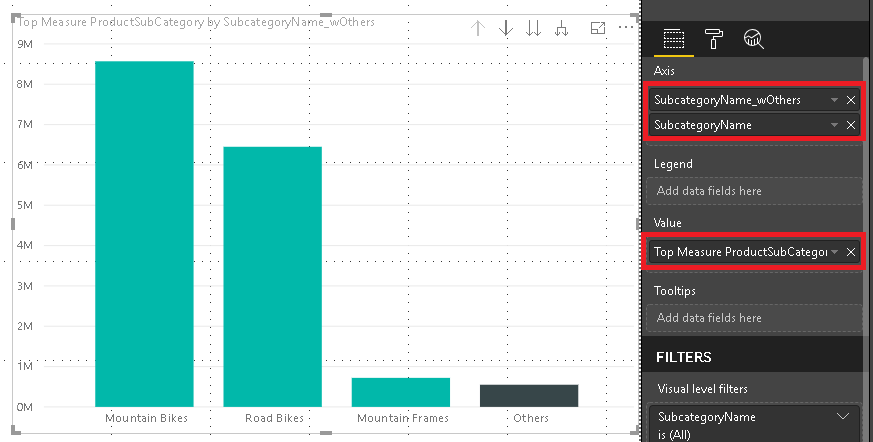
And that’s it! You can now use the column that contains the artificial “Others” in combination with the new measure wherever you like. In a slicer, in a chart or in a table/matrix!

The final PBIX workbook can also be downloaded: TopN_Others.pbix

Excel CUBE-Functions and MDX UniqueNames

Two weeks ago at the German SQL Server Conference 2015 I was at Peter Myer’s session about Mastering the CUBE Functions in Excel. (PS: Peter is also speaking on our upcoming SQLSaturday #374 in Vienna next week and at PASS SQLRally in Copenhagen the week after). After his session we had a further discussion about this topic and our experiences on how to use Excels CUBE-functions in order to build nice Dashboards with native Excel functionalities that also work with e.g. Excel Services. Its always great to exchange with people that share the same passion on he same topic! One thing we both agreed on that is missing currently is a way to get the MDX UniqueName of something that is selected in a slicer, filter or simply in a cell using CUBEMEMBER-function. I once used a special Cube Measure which was created in MDX Script which returned the UniqueName of a given member that was selected together with this special measure. For this to work with Excel you need to know how Excel builds the MDX when querying cube values using CUBEVALUE-function. Here is a little example:
Excel_CubeValue_Formula
This produces the following MDX query:

  1. SELECT
  2. {
  3.     (
  4.         [Measures].[Internet Sales Amount],
  5.         [Product].[Category].&[1]
  6.     )
  7. } ON 0
  8. FROM [Adventure Works]
  9. CELL PROPERTIES VALUE, FORMAT_STRING, LANGUAGE, BACK_COLOR, FORE_COLOR, FONT_FLAGS

So it basically creates a tuple that contains everything you pass into the CUBEVALUE-Function as a parameter. Knowing this we can create a calculated measure to get the MDX UniqueName of this tuple using MDX StrToTuple()- and MDX AXIS()-function:

  1. MEMBER [Measures].[Excel TupleToStr] AS (
  2. TupleToStr(axis(0).item(0))
  3. )

Replacing the [Measures].[Internet Sales Amount] of our initial CUBEVALUE-function with this new measure would return this to Excel:

  1. ([Measures].[Internet Sales Amount],[Product].[Category].&[1])


Ok, so far so good but nothing really useful as you need to hardcode the member’s UniqueName into the CUBEVALUE-function anyway so you already know the UniqueName.
However, this is not the case if you are dealing with Pivot Table Page Filters and/or Slicers! You can simply refer to them within the CUBEVALUE-function but you never get the UniqueName of the selected item(s). Well, at least not directly! But you can use the approach described above, using an special MDX calculated measure, to achieve this as I will demonstrate on the next pages.

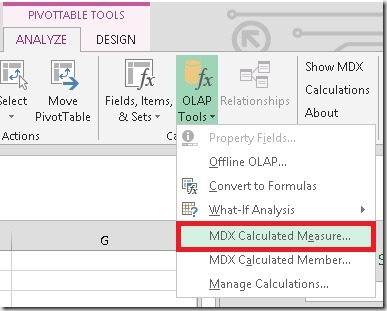
Calculated measures can only be created using the Pivot Table interface but can also be used in CUBE-functions. So first thing you need to do is to create a Pivot Table and add a new MDX Calculated Measure:
Excel_Create_MDX_calculated_measure

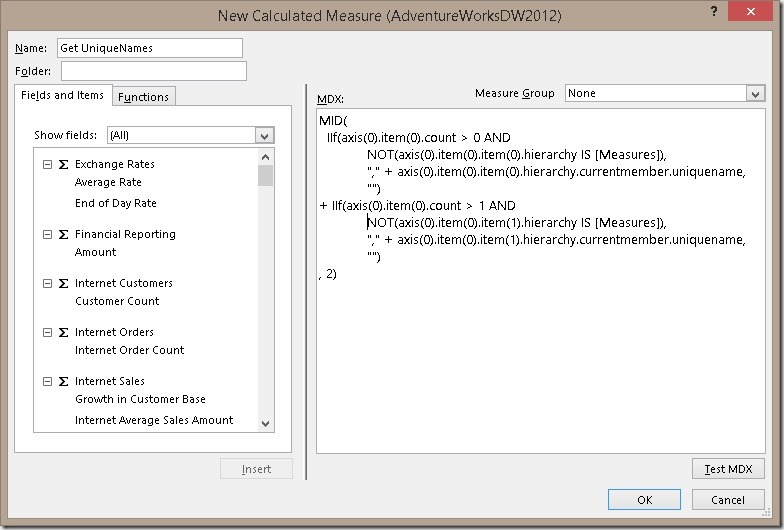
!Caution! some weird MDX coming !Caution!


Excel_Create_MDX_calculated_measure2

You may wonder, why such a complex MDX is necessary and what it actually does. What it does is the following: Based on the example MDX query that Excel generates (as shown above) this is a universal MDX that returns the MDX UniqueName of any other member that is selected together with our measure using the CUBEVALUE-function. It also removes the UniqueName of the measure itself so the result can be used again with any other measure, e.g. [Internet Sales Amount]
The reason why it is rather complex is that Excel may group similar queries and execute them as a batch/as one query to avoid too many executions which would slow down the overall performance. So we cannot just reference the first element of our query as it may belong to any other CUBEVALUE-function. This MDX deals with all this kinds of issues.

The MDX above allows you to specify only two additional filters but it may be extended to any number of filters that you pass in to the CUBEMEMBER-function. This would be the general pattern:

  1. MID(
  2.   IIf(axis(0).item(0).count > 0 AND
  3.         NOT(axis(0).item(0).item(0).hierarchy IS [Measures]),
  4.     "," + axis(0).item(0).item(0).hierarchy.currentmember.uniquename,
  5.     "")
  6. + IIf(axis(0).item(0).count > 1 AND
  7.         NOT(axis(0).item(0).item(1).hierarchy IS [Measures]),
  8.     "," + axis(0).item(0).item(1).hierarchy.currentmember.uniquename,
  9.     "")
  10. + IIf(axis(0).item(0).count > n AND
  11.         NOT(axis(0).item(0).item(n).hierarchy IS [Measures]),
  12.     "," + axis(0).item(0).item(n).hierarchy.currentmember.uniquename,
  13.     "")
  14. , 2)

After creating this measure we can now use it in our CUBE-functions in combination with our filters and slicers:
Excel_MDX_CUBEVALUE_UniqueNames_Filter
Excel_MDX_CUBEVALUE_UniqueNames_Slicer

You may noted that I had to use CUBERANKEDMEMBER here. This is because filters and slicers always return a set and if we would pass in a set to our CUBEVALUE function a different MDX query would be generated which would not allow us to extract the single UniqueNames of the selected items using the approach above (or any other MDX I could think of). So, this approach currently only works with single selections! I hope that the Excel team will implement a native function to extract the UniqueName(s) of the selected items in the future to make this workaround obsolete!

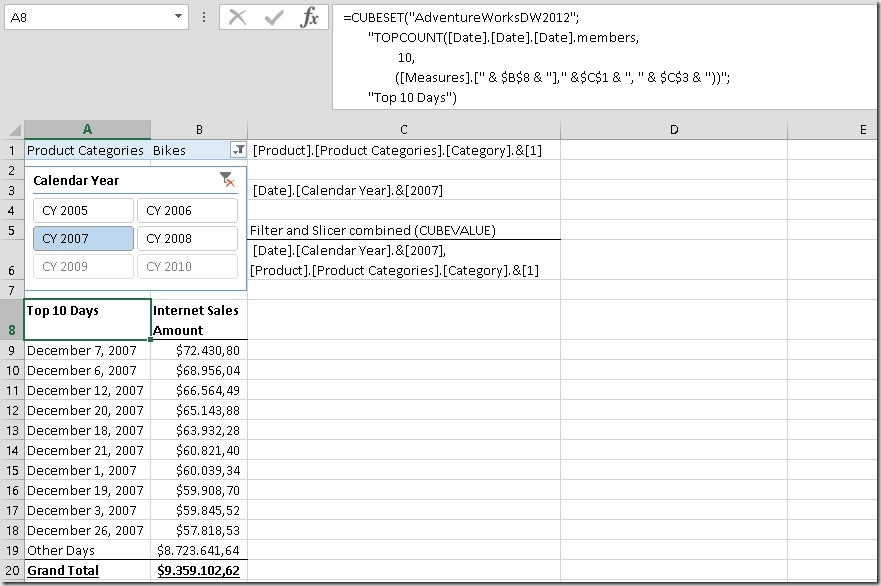
Once we have our UniqeName(s) we can now use them in e.g. a CUBESET-function to return the Top 10 days for a given group of product (filter) and the selected year (slicer):
Excel_MDX_CUBESET_TopCount

And that’s it!

So why is this so cool?

  • It works with SSAS (multidimensional and tabular) and Power Pivot as Excel still uses MDX to query all those sources. It may also work with SAP HANA’s ODBO connector but I have not tested this yet!
  • It does not require any VBA which would not work in Excel Services – this solution does!
  • The calculation is stored within the Excel Workbook so it can be easily shared with other users!
  • There is no native Excel functionality which would allow you to create a simple Top 10 report which works with filters and slicers as shown above or any more complex dynamic report/dashboard with any dynamic filtering.

So no more to say here – Have fun creating your interactive Excel web dashboards!

Download sample Workbook: Samples.xlsx

Note: You may also rewrite any TOPCOUNT expression and use the 4th and 5h parameter of the CUBESET-function instead. This is more native and does not require as much MDX knowledge:Excel_MDX_CUBESET_TopCount_Native
However, if you are not familiar with MDX, I highly recommend to learn it before you write any advanced calculations as show above as otherwise the results might be a bit confusing in the beginning! Especially if you filter and use TOPCOUNT on the same dimension!

Universal Quantiles Calculation for PowerPivot using DAX

In my last post I showed a new approach on how to calculate the median in PowerPivot using DAX. In the comments the question was raised whether it is possible to make that calculation universal for all kind of Quantiles like Median, Quartiles, Percentiles, etc. and that’s what this post is about.

Lets analyze the final Median calculation from the last post:

Median SA Months:=CALCULATE([SumSA],
TOPN(
2-MOD([Cnt_Months], 2),
TOPN(
([Cnt_Months] + 1) / 2,
VALUES(‘Date’[Month]),
[SumSA]),
[SumSA],
1))
/
(2-MOD([Cnt_Months], 2))


The Median defines the value in the middle of an ordered set. To get the first half (+1 to handle even and odd sets) of the whole we are using TOPN function:

TOPN(
([Cnt_Months] + 1) / 2,
VALUES(‘Date’[Month]),
[SumSA]),

The important part here is the “divide by 2” to split the set in the middle to start our Median calculation. Instead of dividing by 2 we could also multiply by 0.5 where 0.5 would be the separator for our quantile (in this case the Median). This expression can be made dynamic. For the first Quartile we would use 0.25 for the second Quartile (=Median) we would use 0.5 and for the third Quartile we would use 0.75.

I created a little linked table to demonstrate the dynamic approach:

Quantile SortOrder Percentage
Median 1 0.5000
Quartile 1 401 0.2500
Quartile 2 402 0.5000
Quartile 3 403 0.7500
Sextile 1 601 0.1667
Sextile 2 602 0.3333
Sextile 3 603 0.5000
Sextile 4 604 0.6667
Sextile 5 605 0.8333

We also need to add a calculated measure that returns the percentage-value of the currently selected Quantile:

SelectedQuantile:=IF(
HASONEVALUE(Quantiles[Percentage]),
VALUES(Quantiles[Percentage]))


Now we can change our old Median-calculation to be dynamic by using the measure defined above:

Quantile SA Months:=CALCULATE([SumSA],
TOPN(
2 – MOD([Cnt_Months], 2),
TOPN(
ROUNDUP(([Cnt_Months] + 1) * [SelectedQuantile], 0),
VALUES(‘Date’[Month]),
[SumSA]),
[SumSA],
1))
/
(2 – MOD([Cnt_Months], 2))

We also need to explicitly add ROUNDUP() as “([Cnt_Months] + 1) * [SelectedQuantile]” may return any decimal places whereas the previous divide by 2 could only result in a x.5 which was rounded up automatically. And well, that’s all we need to change in order to make the calculation universal for all different Quantiles! The rest is the same logic that I already described for Median calculation.


Download Final Model (Office 2013!)

Calculating Median in PowerPivot using DAX

I just came across this blog post by Bill Anton where he discusses several approaches to calculated the Median of a given set in T-SQL, MDX and DAX. In the end of his post when it comes to the DAX calculation, he references several post by Marco, Alberto and Javier (post1, post2) that already address that kind of calculation in DAX. But he also claims that non of the solutions is “elegant”. Well, reason enough for me to try it on my own and here is what I came up with. Its up to you to decide whether this solution is more elegant than the others or not 🙂

In general, the median calculation always varies depending on the number of items and whether this number is even or odd.
For an even population the median is the mean of the values in the middle:
the median of {3, 5, 7, 9} is is (5 + 7)/2 = 6
For an odd population, the median is the value in the middle:
the median of {3, 5, 9} is 5

In both cases the values have to be ordered before the calculation. Note that it does not make a difference whether the values are sorted in ascending or descending order.

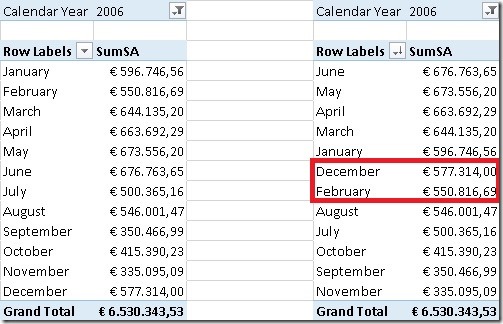
OrderedValues

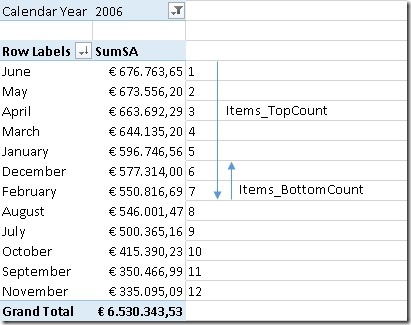
In this example, our set contains 12 items (=months) so we have to find the 2 items in the middle of the ordered set – December and February – and calculate the mean.

So, how can we address this problem using DAX? Most of the posts I mentioned above use some kind of combination of ranking – RANKX() – and filtering – FILTER(). For my approach I will use none of these but use TOPN instead (yes, I really like that function as you probably know if you followed my blog for some time).

In this special case, TOPN() can do both, ranking and filtering for us. But first of all we need to know how many items exist in our set:

Cnt_Months:=DISTINCTCOUNT(‘Date’[Month])


This value will be subsequently used in our next calculations.

To find the value(s) in the middle I use TOPN() twice, first to get the first half of the items (similar to TopCount) and then a second time to get the last values that we need for our median calculation (similar to BottomCount):

TopBottom

As the median calculation is different for even and odd sets, this also has to be considered in our calculation. For both calculations MOD()-function is used to distinguish both cases:

Items_TopCount:=IF(MOD([Cnt_Months],2) = 0,
([Cnt_Months] / 2) + 1,
([Cnt_Months] + 1) / 2)

For an even number of items (e.g. 12) we simply divide the count of items by 2 and add 1 which gives us a (12 / 2) + 1 = 7 for our sample.
For an odd number of items (e.g. 5) we first add 1 to our count of items and then divide by 2 which gives us (5 + 1) / 2 = 3

Items_BottomCount:=IF(MOD([Cnt_Months],2) = 0, 2, 1)

For an even number of items we have to consider the last 2 values whereas for an odd number of items we only have to consider the last value.


These calculations are then used in our median calculation:

Median SA Months:=CALCULATE([SumSA],
TOPN(
[Items_BottomCount],
TOPN(
[Items_TopCount],
VALUES(‘Date’[Month]),
[SumSA]),
[SumSA] * -1))
/
[Items_BottomCount]

As DAX has no built-in BOTTOMN()-function, we need to “abuse” the TOPN() function and multiply the OrderBy-value by “–1” to get the BOTTOMN() functionality. As you can see most of the logic is already handled by our [Items_TopCount] and [Items_BottomCount] measures and this pattern can be reused very easily.


Of course all these calculations can also be combined and the use of IF() can be avoided:

Median SA Months v2:=CALCULATE([SumSA],
TOPN(
2 – MOD([Cnt_Months], 2),
TOPN(
([Cnt_Months] + 1) / 2,
VALUES(‘Date’[Month]),
[SumSA]),
[SumSA] * -1))
/
(2 – MOD([Cnt_Months], 2))

Note: for an even population ([Cnt_Months] + 1) / 2 returns X.5 which is automatically rounded up when it is used in a function that expects a whole number. In our example this is what happens: (12 + 1) / 2 = 6.5 –> 7

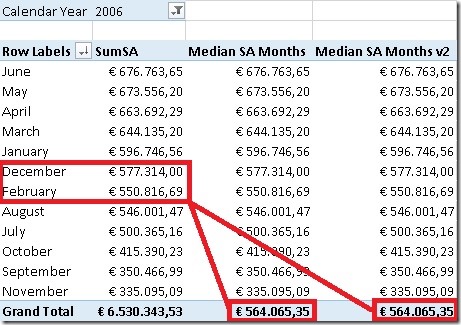
These are the final results:

FinalResults


Additional content:

We could also use AVERAGEX() to calculate our median but I think that it is some kind of overhead to use AVERAGEX() just to divide by “1” or “2” depending on the number of items that our TOPN-functions return:

Median SA Months AvgX:=AVERAGEX(
TOPN(
2-MOD([Cnt_Months], 2),
TOPN(
([Cnt_Months] +1) / 2,
VALUES(‘Date’[Month]),
[SumSA]),
[SumSA] * -1),
[SumSA])


As you can see there are various approaches to calculate the median, its up to you which on you like most. I have not tested any of them in terms of performance over bigger sets – this may be topic for an upcoming post.


Download Final Model (Office 2013!)